Lululemon 2014 Annual Report Download - page 26
Download and view the complete annual report
Please find page 26 of the 2014 Lululemon annual report below. You can navigate through the pages in the report by either clicking on the pages listed below, or by using the keyword search tool below to find specific information within the annual report.-
 1
1 -
2
-
3
-
4
-
5
-
6
-
7
-
8
-
9
-
10
-
11
-
12
-
13
-
14
-
15
-
 16
16 -
 17
17 -
 18
18 -
 19
19 -
 20
20 -
 21
21 -
 22
22 -
 23
23 -
 24
24 -
 25
25 -
 26
26 -
 27
27 -
 28
28 -
 29
29 -
 30
30 -
 31
31 -
 32
32 -
 33
33 -
 34
34 -
 35
35 -
 36
36 -
37
-
38
-
39
-
40
-
41
-
42
-
43
-
44
-
45
-
46
-
47
-
48
-
49
-
50
-
51
-
52
-
53
-
54
-
55
-
56
-
57
-
58
-
59
-
60
-
61
-
62
-
63
-
64
-
65
-
66
-
67
-
68
-
69
-
70
-
71
-
72
-
73
-
74
-
75
-
76
-
77
-
78
-
79
-
80
-
81
-
82
-
83
-
84
-
85
-
86
-
87
-
88
-
89
-
90
-
91
-
92
-
93
-
94
-
95
-
96
 |
 |

Table of Contents
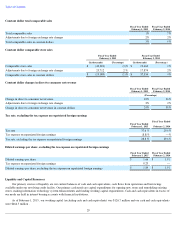
Refer to the non-GAAP reconciliation tables contained in the "Results of Operations" section of this "Item 7. Management's Discussion
and Analysis of Financial Condition and Results of Operations" for reconciliations of constant dollar total comparable sales, constant dollar
comparable store sales, constant dollar changes in direct to consumer net revenue, the fiscal 2014 tax rate excluding the tax expense on the
repatriation of foreign earnings, and diluted earnings per share excluding the tax expense on the repatriation of foreign earnings to measures
calculated in accordance with United States generally accepted accounting principles ("GAAP").
General
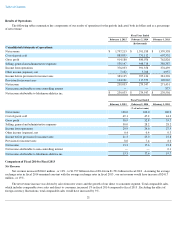
Net revenue is comprised of corporate-owned store net revenue, direct to consumer sales through www.lululemon.com , www.ivivva.com
and other country and region specific websites, and other net revenue, which includes outlet sales, showroom sales, sales to wholesale accounts,
warehouse sales, and sales from temporary locations.
Cost of goods sold includes the cost of purchased merchandise, including in-bound freight, duty and nonrefundable taxes incurred in
delivering the goods to our distribution centers. It also includes occupancy costs and depreciation expense for our corporate-owned store
locations, all costs incurred in operating our distribution centers and production, design and merchandise departments, hemming, and shrink and
valuation reserves. The primary drivers of the costs of individual goods are the costs of raw materials and labor in the countries where we source
our merchandise.
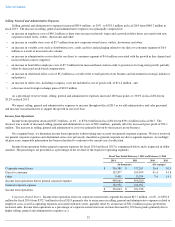
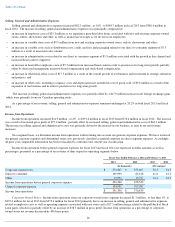
Selling, general and administrative expenses consist of all operating costs not otherwise included in cost of goods sold. We anticipate that
our selling, general and administrative expenses will increase in absolute dollars due to anticipated continued growth of our corporate support
staff and store-level employees.
Provision for income taxes depends on the statutory tax rates in the countries where we sell our products. We anticipate that in the future
we may start to sell our products directly to some customers located in countries that we have not yet operated in, in which case we would
become subject to taxation based on the foreign statutory rates in the countries where these sales take place and our effective tax rate could
fluctuate accordingly.
20
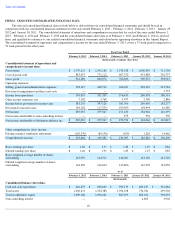
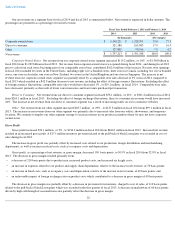
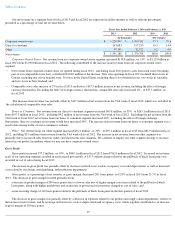
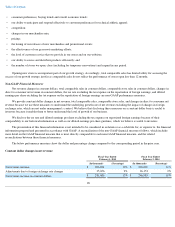
• Gross profit for fiscal 2014 increased by 9% to $914.2 million , from $840.1 million in fiscal 2013 . As a percentage of net revenue, gross
profit decreased to 50.9% compared to 52.8% in fiscal 2013 . The decrease in the gross margin percentage was primarily due to product
mix, increased product costs, and increased air freight usage.
• Income from operations for fiscal 2014 decreased by 4% to $376.0 million , from $391.4 million in fiscal 2013 . As a percentage of net
revenue, income from operations decreased to 20.9% compared to 24.6% of net revenue in fiscal 2013 . The decrease in income from
operations was a result of an increase in selling, general and administration expenses, relative to the increase in net revenue, partially offset
by an increase in gross margin.
• Tax expense for fiscal 2014 increased by 23% to $144.1 million , from $117.6 million in fiscal 2013
. Fiscal 2014 includes a tax expense of
$33.7 million related to the repatriation of foreign earnings that will be used to fund the share buyback program. The tax rate excluding the
$33.7 million tax expense on the repatriation of foreign earnings would have been 28.8% , compared to 29.6% in fiscal 2013. The tax rate
for fiscal 2014 , including the tax expense on the repatriation of foreign earnings, was 37.6% .
• Diluted earnings per share for fiscal 2014 were $1.66 . compared to $1.91 in fiscal 2013 . Excluding the tax expense of $33.7 million on
the repatriated foreign earnings, diluted earnings per share were $1.89 for fiscal 2014.