Lululemon 2014 Annual Report Download - page 35
Download and view the complete annual report
Please find page 35 of the 2014 Lululemon annual report below. You can navigate through the pages in the report by either clicking on the pages listed below, or by using the keyword search tool below to find specific information within the annual report.-
 1
1 -
2
-
3
-
4
-
5
-
6
-
7
-
8
-
9
-
10
-
11
-
12
-
13
-
14
-
15
-
16
-
17
-
18
-
19
-
20
-
21
-
22
-
23
-
24
-
 25
25 -
 26
26 -
 27
27 -
 28
28 -
 29
29 -
 30
30 -
 31
31 -
 32
32 -
 33
33 -
 34
34 -
 35
35 -
 36
36 -
 37
37 -
 38
38 -
 39
39 -
 40
40 -
 41
41 -
 42
42 -
 43
43 -
 44
44 -
 45
45 -
46
-
47
-
48
-
49
-
50
-
51
-
52
-
53
-
54
-
55
-
56
-
57
-
58
-
59
-
60
-
61
-
62
-
63
-
64
-
65
-
66
-
67
-
68
-
69
-
70
-
71
-
72
-
73
-
74
-
75
-
76
-
77
-
78
-
79
-
80
-
81
-
82
-
83
-
84
-
85
-
86
-
87
-
88
-
89
-
90
-
91
-
92
-
93
-
94
-
95
-
96
 |
 |
Table of Contents
Constant dollar total comparable sales
Constant dollar comparable store sales
Constant dollar changes in direct to consumer net revenue
Tax rate, excluding the tax expense on repatriated foreign earnings
Diluted earnings per share, excluding the tax expense on repatriated foreign earnings
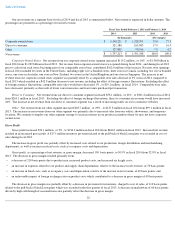
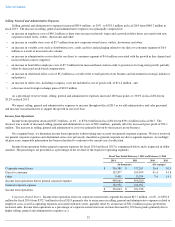
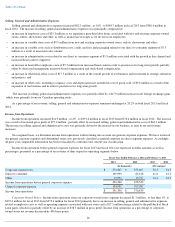
Liquidity and Capital Resources
Our primary sources of liquidity are our current balances of cash and cash equivalents, cash flows from operations and borrowings
available under our revolving credit facility. Our primary cash needs are capital expenditures for opening new stores and remodeling existing
stores, making information technology system enhancements and funding working capital requirements. Cash and cash equivalents in excess of
our needs are held in interest bearing accounts with financial institutions.
As of February 1, 2015 , our working capital (excluding cash and cash equivalents) was $126.7 million and our cash and cash equivalents
were $664.5 million .
29
Fiscal Year Ended
February 1, 2015
Fiscal Year Ended
February 2, 2014
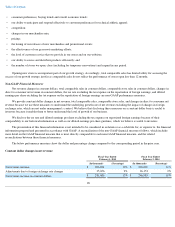
Total comparable sales
1
%
7
%
Adjustments due to foreign exchange rate changes
2
%
2
%
Total comparable sales in constant dollars
3
%
9
%
Fiscal Year Ended
February 1, 2015
Fiscal Year Ended
February 2, 2014
(In thousands)
(Percentage)
(In thousands)
(Percentage)
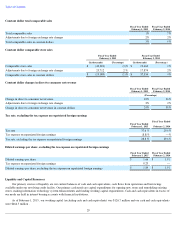
Comparable store sales
$
(42,801
)
(3
)%
$
19,460
2
%
Adjustments due to foreign exchange rate changes
23,712
2
%
17,874
2
%
Comparable store sales in constant dollars
$
(19,089
)
(1
)%
$
37,334
4
%
Fiscal Year Ended
February 1, 2015
Fiscal Year Ended
February 2, 2014
(Percentage)
Change in direct to consumer net revenue
22
%
36
%
Adjustments due to foreign exchange rate changes
2
%
2
%
Change in direct to consumer net revenue in constant dollars
24
%
38
%
Fiscal Year Ended
February 1, 2015
Fiscal Year Ended
February 2, 2014
Tax rate
37.6
%
29.6
%
Tax expense on repatriated foreign earnings
(8.8
)%
—
%
Tax rate, excluding the tax expense on repatriated foreign earnings
28.8
%
29.6
%
Fiscal Year Ended
February 1, 2015
Fiscal Year Ended
February 2, 2014
Diluted earnings per share
$
1.66
$
1.91
Tax expense on repatriated foreign earnings
0.23
—
Diluted earnings per share, excluding the tax expense on repatriated foreign earnings
$
1.89
$
1.91