Lululemon 2014 Annual Report Download - page 36
Download and view the complete annual report
Please find page 36 of the 2014 Lululemon annual report below. You can navigate through the pages in the report by either clicking on the pages listed below, or by using the keyword search tool below to find specific information within the annual report.-
 1
1 -
2
-
3
-
4
-
5
-
6
-
7
-
8
-
9
-
10
-
11
-
12
-
13
-
14
-
15
-
16
-
17
-
18
-
19
-
20
-
21
-
22
-
23
-
24
-
25
-
 26
26 -
 27
27 -
 28
28 -
 29
29 -
 30
30 -
 31
31 -
 32
32 -
 33
33 -
 34
34 -
 35
35 -
 36
36 -
 37
37 -
 38
38 -
 39
39 -
 40
40 -
 41
41 -
 42
42 -
 43
43 -
 44
44 -
 45
45 -
 46
46 -
47
-
48
-
49
-
50
-
51
-
52
-
53
-
54
-
55
-
56
-
57
-
58
-
59
-
60
-
61
-
62
-
63
-
64
-
65
-
66
-
67
-
68
-
69
-
70
-
71
-
72
-
73
-
74
-
75
-
76
-
77
-
78
-
79
-
80
-
81
-
82
-
83
-
84
-
85
-
86
-
87
-
88
-
89
-
90
-
91
-
92
-
93
-
94
-
95
-
96
 |
 |

Table of Contents
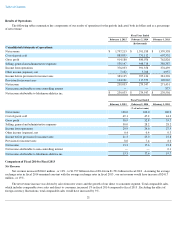
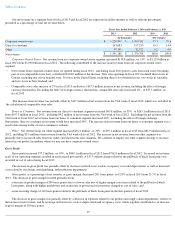
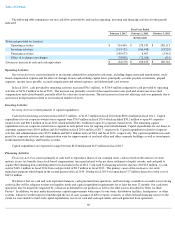
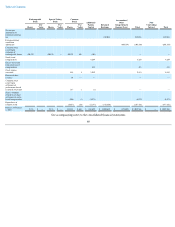
The following table summarizes our net cash flows provided by and used in operating, investing and financing activities for the periods
indicated:
Operating Activities
Operating Activities consist primarily of net income adjusted for certain non-cash items, including depreciation and amortization, stock-
based compensation expense and the effect of changes in non-cash working capital items, principally accounts payable, inventories, prepaid
expenses, income taxes payable, accrued compensation and related expenses, and deferred gift card revenue.
In fiscal 2014 , cash provided by operating activities increased $36.1 million , to $314.4 million compared to cash provided by operating
activities of $278.3 million in fiscal 2013 . The increase was primarily a result of decreased income taxes paid and an increase in accrued
compensation and related benefits, partially offset by a decrease in net income. The net increase in items not affecting cash was primarily due to
an increase in depreciation related to our increased number of stores.
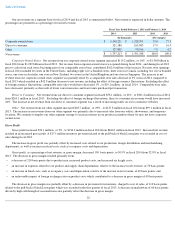
Investing Activities
Investing Activities relate primarily to capital expenditures.
Cash used in investing activities increased $13.3 million , to $119.7 million in fiscal 2014 from $106.4 million in fiscal 2013 . Capital
expenditures for our corporate-owned stores segment were $76.9 million in fiscal 2014 which included $38.1 million to open 49 corporate-
owned stores and $60.2 million in fiscal 2013 which included $31.3 million to open 45 corporate-owned stores. The remaining capital
expenditures for our corporate-owned stores segment in each period were for ongoing store refurbishment. Capital expenditures for our direct to
consumer segment were $10.0 million and $6.0 million in fiscal 2014 and fiscal 2013 , respectively. Capital expenditures related to corporate
activities and administration were $32.9 million and $40.2 million in fiscal 2014 and fiscal 2013 , respectively. The capital expenditures in each
period for corporate activities and administration were for improvements at our head office and other corporate buildings as well as investments
in information technology and business systems.
Capital expenditures are expected to range between $130 million and $135 million in fiscal 2015 .
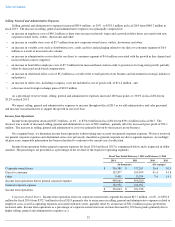
Financing Activities
Financing Activities consist primarily of cash used to repurchase shares of our common stock, cash received on the exercise of stock
options, excess tax benefits from stock-based compensation, taxes paid related to the net share settlement of equity awards, and cash paid to
acquire the remaining non-controlling interest in Australia in fiscal 2012. Cash used by financing activities increase d $158.0 million , to cash
used of $149.1 million in fiscal 2014 from cash provided of $8.9 million in fiscal 2013 . The primary cause of this increase is our stock
repurchase program which began in the second quarter of fiscal 2014 . During fiscal 2014 we repurchased 3.7 million shares for a total cost of
$147.4 million .
We believe that our cash and cash equivalent balances, cash generated from operations, and borrowings available to us under our revolving
credit facility will be adequate to meet our liquidity needs and capital expenditure requirements for at least the next 12 months. Our cash from
operations may be negatively impacted by a decrease in demand for our products as well as the other factors described in "Item 1A. Risk
Factors". In addition, we may make discretionary capital improvements with respect to our stores, distribution facilities, headquarters, or other
systems, which we would expect to fund through the use of cash, issuance of debt or equity securities or other external financing sources to the
extent we were unable to fund such capital expenditures out of our cash and cash equivalents and cash generated from operations.
30
Fiscal Year Ended
February 1, 2015
February 2, 2014
February 3, 2013
(In thousands)
Total cash provided by (used in):
Operating activities
$
314,449
$
278,339
$
280,113
Investing activities
(119,733
)
(106,408
)
(93,229
)
Financing activities
(149,077
)
8,907
(5,491
)
Effect of exchange rate changes
(79,809
)
(72,368
)
(651
)
(Decrease) increase in cash and cash equivalents
$
(34,170
)
$
108,470
$
180,742