Lululemon 2014 Annual Report Download - page 57
Download and view the complete annual report
Please find page 57 of the 2014 Lululemon annual report below. You can navigate through the pages in the report by either clicking on the pages listed below, or by using the keyword search tool below to find specific information within the annual report.-
 1
1 -
2
-
3
-
4
-
5
-
6
-
7
-
8
-
9
-
10
-
11
-
12
-
13
-
14
-
15
-
16
-
17
-
18
-
19
-
20
-
21
-
22
-
23
-
24
-
25
-
26
-
27
-
28
-
29
-
30
-
31
-
32
-
33
-
34
-
35
-
36
-
37
-
38
-
39
-
40
-
41
-
42
-
43
-
44
-
45
-
46
-
 47
47 -
 48
48 -
 49
49 -
 50
50 -
 51
51 -
 52
52 -
 53
53 -
 54
54 -
 55
55 -
 56
56 -
 57
57 -
 58
58 -
 59
59 -
 60
60 -
 61
61 -
 62
62 -
 63
63 -
 64
64 -
 65
65 -
 66
66 -
 67
67 -
68
-
69
-
70
-
71
-
72
-
73
-
74
-
75
-
76
-
77
-
78
-
79
-
80
-
81
-
82
-
83
-
84
-
85
-
86
-
87
-
88
-
89
-
90
-
91
-
92
-
93
-
94
-
95
-
96
 |
 |

Table of Contents
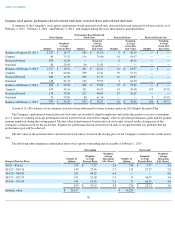
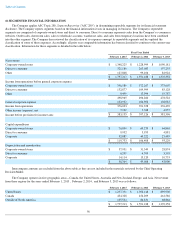
As of February 1, 2015 , the unrecognized compensation cost related to these options was $8,172
, which is expected to be recognized over
a weighted-average period of 3.1 years ; and the total aggregate intrinsic value for stock options outstanding and exercisable was $16,220 . The
weighted-average grant date fair value of options granted during the years ended February 1, 2015 , February 2, 2014 , and February 3, 2013
was $17.69 , $31.96 , and $37.20 , respectively.
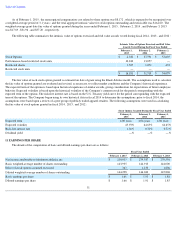
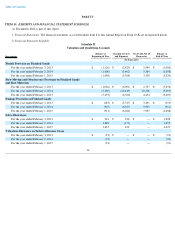
The following table summarizes the intrinsic value of options exercised and full value awards vested during fiscal 2014 , 2013 , and 2012 :
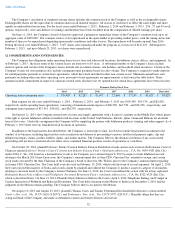
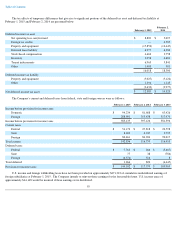
The fair value of each stock option granted is estimated on date of grant using the Black-
Scholes model. The assumptions used to calculate
the fair value of options granted are evaluated and revised, as necessary, to reflect market conditions and the Company's historical experience.
The expected term of the options is based upon historical experience of similar awards, giving consideration for expectations of future employee
behavior. Expected volatility is based upon the historical volatility of the Company's common stock for the period corresponding with the
expected term of the options. The risk-free interest rate is based on the U.S. Treasury yield curve for the period corresponding with the expected
term of the options. The Company began using its own historical data in fiscal 2014 to determine the assumptions; prior to fiscal 2014, the
assumptions were based upon a review of a peer group of publicly traded apparel retailers. The following assumptions were used in calculating
the fair value of stock options granted in fiscal 2014 , 2013 , and 2012 :
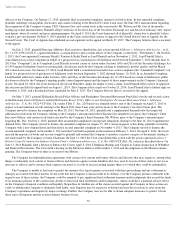
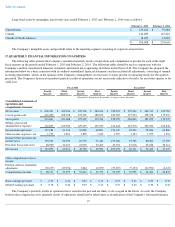
11 EARNINGS PER SHARE
The details of the computation of basic and diluted earnings per share are as follows:
51
Intrinsic Value of Options Exercised and Full Value
Awards Vested During the Fiscal Year Ended
February 1,
2015
February 2,
2014
February 3,
2013
Stock Options
$
4,382
$
37,591
$
53,605
Performance-based restricted stock units
10,242
13,057
—
Restricted shares
1,567
1,070
474
Restricted stock units
—
—
—
$
16,191
$
51,718
$
54,079
Stock Options Granted During the Fiscal Year Ended
February 1,
2015
February 2,
2014
February 3,
2013
Expected term
4.00 years
4.06 years
4.06 years
Expected volatility
45.93
%
64.65
%
64.65
%
Risk-free interest rate
1.04
%
0.72
%
0.72
%
Dividend yield
—
%
—
%
—
%
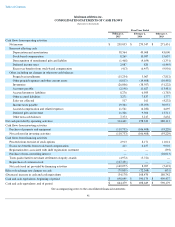
Fiscal Year Ended
February 1, 2015
February 2, 2014
February 3, 2013
Net income attributable to lululemon athletica inc
$
239,033
$
279,547
$
270,556
Basic weighted-average number of shares outstanding
143,935
144,913
144,000
Effect of stock options assumed exercised
363
1,130
1,806
Diluted weighted-average number of shares outstanding
144,298
146,043
145,806
Basic earnings per share
$
1.66
$
1.93
$
1.88
Diluted earnings per share
$
1.66
$
1.91
$
1.85