Lululemon 2014 Annual Report Download - page 34
Download and view the complete annual report
Please find page 34 of the 2014 Lululemon annual report below. You can navigate through the pages in the report by either clicking on the pages listed below, or by using the keyword search tool below to find specific information within the annual report.-
 1
1 -
2
-
3
-
4
-
5
-
6
-
7
-
8
-
9
-
10
-
11
-
12
-
13
-
14
-
15
-
16
-
17
-
18
-
19
-
20
-
21
-
22
-
23
-
 24
24 -
 25
25 -
 26
26 -
 27
27 -
 28
28 -
 29
29 -
 30
30 -
 31
31 -
 32
32 -
 33
33 -
 34
34 -
 35
35 -
 36
36 -
 37
37 -
 38
38 -
 39
39 -
 40
40 -
 41
41 -
 42
42 -
 43
43 -
 44
44 -
45
-
46
-
47
-
48
-
49
-
50
-
51
-
52
-
53
-
54
-
55
-
56
-
57
-
58
-
59
-
60
-
61
-
62
-
63
-
64
-
65
-
66
-
67
-
68
-
69
-
70
-
71
-
72
-
73
-
74
-
75
-
76
-
77
-
78
-
79
-
80
-
81
-
82
-
83
-
84
-
85
-
86
-
87
-
88
-
89
-
90
-
91
-
92
-
93
-
94
-
95
-
96
 |
 |

Table of Contents
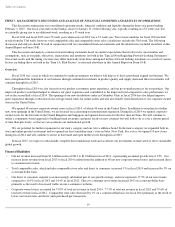
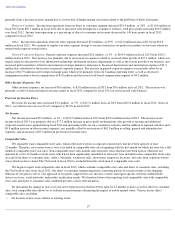
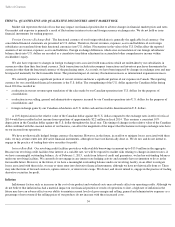
Opening new stores is an important part of our growth strategy. Accordingly, total comparable sales has limited utility for assessing the
success of our growth strategy insofar as comparable sales do not reflect the performance of stores open less than 12 months.
Non
-GAAP Financial Measures
Net revenue changes in constant dollars, total comparable sales in constant dollars, comparable store sales in constant dollars, changes in
direct to consumer net revenue in constant dollars, the tax rate excluding the tax expense on the repatriation of foreign earnings, and diluted
earnings per share excluding the tax expense on the repatriation of foreign earnings are non-GAAP performance measures.
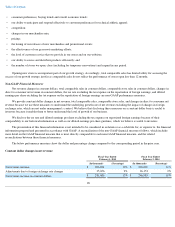
We provide constant dollar changes in net revenue, total comparable sales, comparable store sales, and changes in direct to consumer net
revenue because we use these measures to understand the underlying growth rate of net revenue excluding the impact of changes in foreign
exchange rates, which are not under management’s control. We believe that disclosing these measures on a constant dollar basis is useful to
investors because it enables them to better understand the level of growth of our business.
We disclose the tax rate and diluted earnings per share excluding the tax expense on repatriated foreign earnings because of their
comparability to our historical information as well as our diluted earnings per share guidance, which we believe is useful to investors.
The presentation of this financial information is not intended to be considered in isolation or as a substitute for, or superior to, the financial
information prepared and presented in accordance with GAAP. A reconciliation of the non-GAAP financial measures follows, which includes
more detail on the GAAP financial measure that is most directly comparable to each non-GAAP financial measure, and the related
reconciliations between these financial measures.
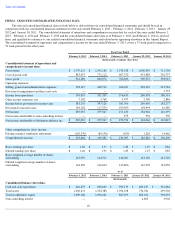
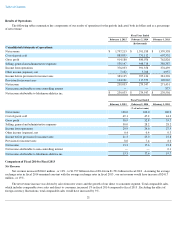
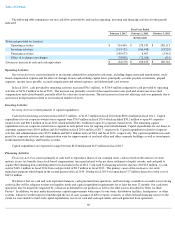
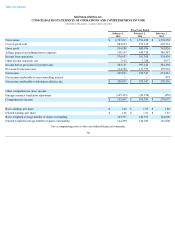
The below performance measures show the dollar and percentage change compared to the corresponding period in the prior year.
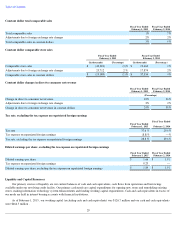
Constant dollar changes in net revenue
28
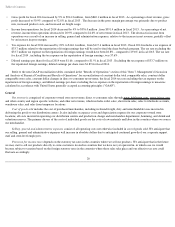
•
consumer preferences, buying trends and overall economic trends;
•
our ability to anticipate and respond effectively to customer preferences for technical athletic apparel;
•
competition;
•
changes in our merchandise mix;
•
pricing;
•
the timing of our releases of new merchandise and promotional events;
•
the effectiveness of our grassroots marketing efforts;
•
the level of customer service that we provide in our stores and on our websites;
•
our ability to source and distribute products efficiently; and
•
the number of stores we open, close (including for temporary renovations) and expand in any period.
Fiscal Year Ended
February 1, 2015
Fiscal Year Ended
February 2, 2014
(In thousands)
(Percentage)
(In thousands)
(Percentage)
Net revenue increase
$
206,024
13
%
$
220,830
16
%
Adjustments due to foreign exchange rate changes
35,656
2
%
26,153
2
%
Net revenue increase in constant dollars
$
241,680
15
%
$
246,983
18
%