Holiday Inn 2014 Annual Report Download - page 81
Download and view the complete annual report
Please find page 81 of the 2014 Holiday Inn annual report below. You can navigate through the pages in the report by either clicking on the pages listed below, or by using the keyword search tool below to find specific information within the annual report.-
 1
1 -
2
-
3
-
4
-
5
-
6
-
7
-
8
-
9
-
10
-
11
-
12
-
13
-
14
-
15
-
16
-
17
-
18
-
19
-
20
-
21
-
22
-
23
-
24
-
25
-
26
-
27
-
28
-
29
-
30
-
31
-
32
-
33
-
34
-
35
-
36
-
37
-
38
-
39
-
40
-
41
-
42
-
43
-
44
-
45
-
46
-
47
-
48
-
49
-
50
-
51
-
52
-
53
-
54
-
55
-
56
-
57
-
58
-
59
-
60
-
61
-
62
-
63
-
64
-
65
-
66
-
67
-
68
-
69
-
70
-
 71
71 -
 72
72 -
 73
73 -
 74
74 -
 75
75 -
 76
76 -
 77
77 -
 78
78 -
 79
79 -
 80
80 -
 81
81 -
 82
82 -
 83
83 -
 84
84 -
 85
85 -
 86
86 -
 87
87 -
 88
88 -
 89
89 -
 90
90 -
 91
91 -
92
-
93
-
94
-
95
-
96
-
97
-
98
-
99
-
100
-
101
-
102
-
103
-
104
-
105
-
106
-
107
-
108
-
109
-
110
-
111
-
112
-
113
-
114
-
115
-
116
-
117
-
118
-
119
-
120
-
121
-
122
-
123
-
124
-
125
-
126
-
127
-
128
-
129
-
130
-
131
-
132
-
133
-
134
-
135
-
136
-
137
-
138
-
139
-
140
-
141
-
142
-
143
-
144
-
145
-
146
-
147
-
148
-
149
-
150
-
151
-
152
-
153
-
154
-
155
-
156
-
157
-
158
-
159
-
160
-
161
-
162
-
163
-
164
-
165
-
166
-
167
-
168
-
169
-
170
-
171
-
172
-
173
-
174
-
175
-
176
-
177
-
178
-
179
-
180
-
181
-
182
-
183
-
184
-
185
-
186
-
187
-
188
-
189
-
190
 |
 |

51
2
3
4
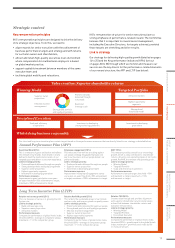
Attractive markets
Highest opportunity
segments
Managed and
franchised model
Scale and efficiency
of operations
Investment in developing
strong technology platforms
Investment in developing
great talent
Whilst doing business responsibly
Preferred brands
delivered through
our people
Superior owner
proposition
Strong brand portfolio
and loyalty programme
Effective channel
managementBuild and
leverage scale
Targeted PortfolioWinning Model
Value creation: Superior shareholder returns
Disciplined Execution
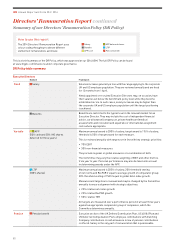
Long Term Incentive Plan (LTIP)
Annual Performance Plan (APP)
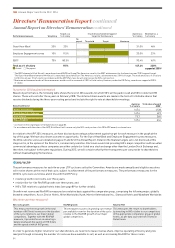
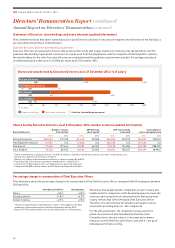
Our short and long-term incentive plans contain targets based on three performance measures that are directly linked to our strategy, as detailed below:
Relative net rooms growth (25%):
This is a measure of success in growing the IHG
System size.
Link to strategic priority:
• Build and leverage scale
• Superior owner proposition
• Attractive markets
Performance measure:
Compared to performance of global hotels index;
threshold (20%) = average of comparator group;
maximum = 1st in the comparator group.
Relative RevPAR growth (25%):
This reflects the sustainable power of our brands
and our scale, and focuses growth on quality rooms.
Link to strategic priority:
• Preferred brands delivered through our people
• Strong brand portfolio and loyalty programme
• Effective channel management
• Superior owner proposition
• Highest opportunity segments
Performance measure:
Compared to performance of global hotels index;
threshold (20%) = average of comparator group;
maximum = 1st in the comparator group.
Relative TSR (50%):
Creates value through and provides alignment
with superior shareholder returns and provides
a direct link between shareholder returns and
executive remuneration.
Link to strategic priority:
• Winning Model
• Targeted Portfolio
• Disciplined Execution
Performance measure:
Compared to performance of global hotels index;
threshold (20%) = growth equal to the global hotels
index; maximum = growth exceeds index by 8%
or more per annum.
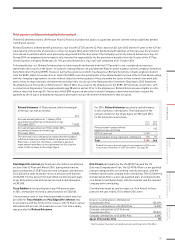
Employee engagement (10%):
This measures how well we are doing against
our people strategy. Engaged employees are
key to our business and our people deliver our
preferred brands.
Link to strategic priority:
• Preferred brands delivered through our people
• Superior owner proposition
• Investment in developing great talent
Performance measure:
Improvement in Employee Engagement survey
score year-on-year; threshold = 50% achievement
vs target; maximum = 200% achievement vs target.
Guest HeartBeat (20%):
This is a measure of guest satisfaction and reflects
the strength of our brands. Each brand is clearly
defined to meet the needs and occasions of our
targeted guest and deliver a consistent experience.
Link to strategic priority:
• Preferred brands delivered through our people
• Strong brand portfolio and loyalty programme
• Superior owner proposition
• Highest opportunity segments
• Investment in developing great talent
Performance measure:
Improvement in guest satisfaction score year-
on-year; threshold = 50% achievement vs target;
maximum = 200% achievement vs target.
EBIT (70%):
This measure provides annual focus on earnings
growth, which is a key contributor to shareholder
returns, driven by core operating inputs of net rooms
growth, RevPAR, fee revenue and operating profit.
Link to strategic priority:
• Winning Model
• Targeted Portfolio
• Scale and efficiency of operations
Performance measure:
Achievement of annual target; threshold = 90%
achievement vs target; maximum = 110%
achievement vs target.
Key remuneration principles
IHG’s remuneration principles are designed to drive the delivery
of its strategic objectives. To do this, we need to:
• align rewards for senior executives with the achievement of
business performance targets and strategy and with returns
for our hotel owners and shareholders;
• attract and retain high-quality executives in an environment
where compensation for multinational employers is based
on global market practice;
• support equitable treatment between members of the same
executive team; and
• facilitate global mobility and relocations.
IHG’s remuneration structure for senior executives places a
strong emphasis on performance-related reward. The Committee
believes that it is important to reward senior management,
including the Executive Directors, for targets achieved, provided
those targets are stretching and drive results.
Link to strategy
Our strategy for delivering high-quality growth (detailed on pages
14 to 25) and the Key performance indicators (KPIs) (set out
on pages 30 to 33) through which we monitor and measure our
success are the key drivers for the performance-related elements
of our reward structure, the APP and LTIP (see below):
Strategic context
79
STRATEGIC REPORT GOVERNANCE
GROUP
FINANCIAL STATEMENTS
PARENT COMPANY
FINANCIAL STATEMENTS
ADDITIONAL
INFORMATION