Holiday Inn 2014 Annual Report Download - page 49
Download and view the complete annual report
Please find page 49 of the 2014 Holiday Inn annual report below. You can navigate through the pages in the report by either clicking on the pages listed below, or by using the keyword search tool below to find specific information within the annual report.-
 1
1 -
2
-
3
-
4
-
5
-
6
-
7
-
8
-
9
-
10
-
11
-
12
-
13
-
14
-
15
-
16
-
17
-
18
-
19
-
20
-
21
-
22
-
23
-
24
-
25
-
26
-
27
-
28
-
29
-
30
-
31
-
32
-
33
-
34
-
35
-
36
-
37
-
38
-
 39
39 -
 40
40 -
 41
41 -
 42
42 -
 43
43 -
 44
44 -
 45
45 -
 46
46 -
 47
47 -
 48
48 -
 49
49 -
 50
50 -
 51
51 -
 52
52 -
 53
53 -
 54
54 -
 55
55 -
 56
56 -
 57
57 -
 58
58 -
 59
59 -
60
-
61
-
62
-
63
-
64
-
65
-
66
-
67
-
68
-
69
-
70
-
71
-
72
-
73
-
74
-
75
-
76
-
77
-
78
-
79
-
80
-
81
-
82
-
83
-
84
-
85
-
86
-
87
-
88
-
89
-
90
-
91
-
92
-
93
-
94
-
95
-
96
-
97
-
98
-
99
-
100
-
101
-
102
-
103
-
104
-
105
-
106
-
107
-
108
-
109
-
110
-
111
-
112
-
113
-
114
-
115
-
116
-
117
-
118
-
119
-
120
-
121
-
122
-
123
-
124
-
125
-
126
-
127
-
128
-
129
-
130
-
131
-
132
-
133
-
134
-
135
-
136
-
137
-
138
-
139
-
140
-
141
-
142
-
143
-
144
-
145
-
146
-
147
-
148
-
149
-
150
-
151
-
152
-
153
-
154
-
155
-
156
-
157
-
158
-
159
-
160
-
161
-
162
-
163
-
164
-
165
-
166
-
167
-
168
-
169
-
170
-
171
-
172
-
173
-
174
-
175
-
176
-
177
-
178
-
179
-
180
-
181
-
182
-
183
-
184
-
185
-
186
-
187
-
188
-
189
-
190
 |
 |

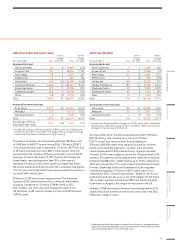
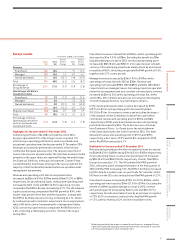
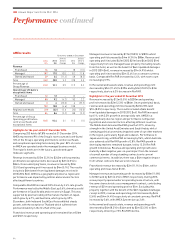
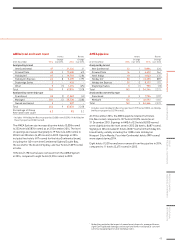
Greater China results
12 months ended 31 December
2014
$m
2013
$m
2014 vs
2013 %
change
2012
$m
2013 vs
2012 %
change
Revenue
Franchised 4333.3 3 –
Managed 99 92 7.6 89 3.4
Owned and leased 139 141 (1.4) 138 2.2
Total 242 236 2.5 230 2.6
Percentage of
Group Revenue 13.0 12.4 0.6 12.5 (0.1)
Operating profit before
exceptional items
Franchised 55– 4 25.0
Managed 63 51 23.5 51 –
Owned and leased 42 47 (10.6) 45 4.4
110 103 6.8 100 3.0
Regional overheads (21) (21) –(19) (10.5)
Total 89 82 8.5 81 1.2
Percentage of Group
Operating profit before
central overheads and
exceptional items
11.0 10.0 1.0 10.6 (0.6)
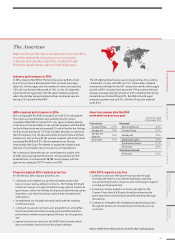
Highlights for the year ended 31December 2014
Comprising 241 hotels (78,194 rooms) at 31 December 2014,
Greater China represented 11% of the Group’s room count and
contributed 11% of the Group’s operating profit before central
overheads and exceptional operating items for the year ended
31 December 2014. 97% of rooms in Greater China are operated
under the managed business model. The region’s hotels are
in the luxury, upscale and upper midscale segments.
Revenue and operating profit before exceptional items increased
by $6m (2.5%) to $242m and by $7m (8.5%) to $89m respectively.
Overall, the region achieved comparable RevPAR growth of
1.6%, slightly stronger than the 1.0% growth achieved in 2013.
This performance was significantly ahead of the industry,
reflecting IHG’s scale and management strength in the region,
and was achieved in a challenging environment with slower
macro-economic conditions, government austerity measures
and protests in Hong Kong. Trading was strongest in tier 1 cities,
especially Shanghai and Guangzhou, with good levels of transient
and corporate business. Performance in tier 2 and 3 cities
continues to be impacted by new supply as these markets develop.
Total RevPAR in the region decreased by 3.4% as hotels opened
in these lower RevPAR markets.
Franchised revenue increased by $1m (33.3%) to $4m whilst
operating profit was flat at $5m. Operating profit was higher than
revenue in both 2014 and 2013 due to joint venture dividend income
received from a hotel in Hong Kong.
Managed revenue increased by $7m (7.6%) to $99m, whilst
operating profit increased by $12m (23.5%) to $63m, reflecting
improvements in operating margin, net rooms growth, and a
small number of one-off items that contributed approximately $5m
to the result. Comparable RevPAR increased by 1.3%, whilst the
Greater China System size grew by 14.7%, driving a 8.5% increase
in total gross revenue derived from rooms business. Total gross
revenue derived from non-rooms business increased by 7.8%.
Owned and leased revenue decreased by $2m (1.4%) to $139m,
driven by a RevPAR decrease of 1.0% at InterContinental Hong
Kong. Operating profit decreased by $5m (10.6%) to $42m.
The decrease in revenue and operating profit at the hotel was
driven primarily by the ongoing development of the area adjacent
to the hotel and protests in central Hong Kong.
Highlights for the year ended 31December 2013
Revenue and operating profit before exceptional items increased
by$6m (2.6%) to $236m and by $1m (1.2%) to $82m respectively.
On an underlying basis, revenue and operating profit increased
by $6m (2.6%) and $2m (2.5%) respectively.
Franchised revenue was flat at $3m and operating profit increased
by $1m (25.0%) to $5m.
Managed revenue increased by $3m (3.4%) to $92m and operating
profit was flat at $51m. RevPAR increased by 0.6%, whilst the
Greater China System size grew by 11.8%, driving a 9.2% increase
in total gross revenue derived from rooms business. Total gross
revenue derived from non-rooms business increased by 3.0%.
Operating profit was partly offset by increased investment to
drive future growth.
Owned and leased revenue at InterContinental Hong Kong
increased by $3m (2.2%) to $141m, driven by a 4.5% increase in
total gross revenue derived from non-rooms business, although
this was partly offset by a RevPAR decline of 0.1%. Operating profit
increased by $2m (4.4%) to $47m.
47
STRATEGIC REPORT GOVERNANCE
GROUP
FINANCIAL STATEMENTS
PARENT COMPANY
FINANCIAL STATEMENTS
ADDITIONAL
INFORMATION