Holiday Inn 2014 Annual Report Download - page 122
Download and view the complete annual report
Please find page 122 of the 2014 Holiday Inn annual report below. You can navigate through the pages in the report by either clicking on the pages listed below, or by using the keyword search tool below to find specific information within the annual report.-
 1
1 -
2
-
3
-
4
-
5
-
6
-
7
-
8
-
9
-
10
-
11
-
12
-
13
-
14
-
15
-
16
-
17
-
18
-
19
-
20
-
21
-
22
-
23
-
24
-
25
-
26
-
27
-
28
-
29
-
30
-
31
-
32
-
33
-
34
-
35
-
36
-
37
-
38
-
39
-
40
-
41
-
42
-
43
-
44
-
45
-
46
-
47
-
48
-
49
-
50
-
51
-
52
-
53
-
54
-
55
-
56
-
57
-
58
-
59
-
60
-
61
-
62
-
63
-
64
-
65
-
66
-
67
-
68
-
69
-
70
-
71
-
72
-
73
-
74
-
75
-
76
-
77
-
78
-
79
-
80
-
81
-
82
-
83
-
84
-
85
-
86
-
87
-
88
-
89
-
90
-
91
-
92
-
93
-
94
-
95
-
96
-
97
-
98
-
99
-
100
-
101
-
102
-
103
-
104
-
105
-
106
-
107
-
108
-
109
-
110
-
111
-
 112
112 -
 113
113 -
 114
114 -
 115
115 -
 116
116 -
 117
117 -
 118
118 -
 119
119 -
 120
120 -
 121
121 -
 122
122 -
 123
123 -
 124
124 -
 125
125 -
 126
126 -
 127
127 -
 128
128 -
 129
129 -
 130
130 -
 131
131 -
 132
132 -
133
-
134
-
135
-
136
-
137
-
138
-
139
-
140
-
141
-
142
-
143
-
144
-
145
-
146
-
147
-
148
-
149
-
150
-
151
-
152
-
153
-
154
-
155
-
156
-
157
-
158
-
159
-
160
-
161
-
162
-
163
-
164
-
165
-
166
-
167
-
168
-
169
-
170
-
171
-
172
-
173
-
174
-
175
-
176
-
177
-
178
-
179
-
180
-
181
-
182
-
183
-
184
-
185
-
186
-
187
-
188
-
189
-
190
 |
 |

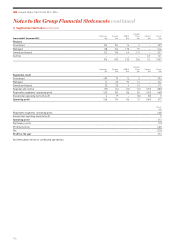
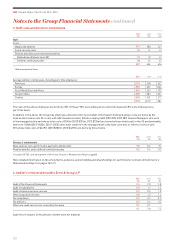
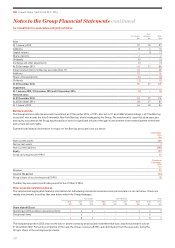
3. Staff costs and Directors’ emoluments
2014
$m
2013
$m
2012
$m
Staff
Costs:
Wages and salaries 577 580 547
Social security costs 42 41 44
Pension and other post-retirement benefits:
Defined benefit plans1 (note 25) 10 10 13
Defined contribution plans 28 25 22
657 656 626
1 Before exceptional items.
2014 2013 2012
Average number of employees, including part-time employees:
Americas 2,191 2,548 2,552
Europe 1,557 1,602 1,866
Asia, Middle East and Africa 1,451 1,545 1,195
Greater China 1,092 1,083 1,051
Central 1,506 1,401 1,317
7,797 8,179 7,981
The costs of the above employees are borne by IHG. Of these, 92% were employed on a full-time basis and 8% were employed on a
part-time basis.
In addition to the above, the Group has employees who work directly on behalf of the System Fund and whose costs are borne by the
Fund as disclosed in note 32. In line with IHG’s business model, IHG also employs 602 (2013 578, 2012 587) General Managers who work
in the managed hotels and whose total costs of $142m (2013 $135m, 2012 $132m) are borne by those hotels and, in the US predominantly,
there are 11,848 (2013 10,834, 2012 11,053) other hotel workers in the managed hotels who have contracts or letters of service with
IHG whose total costs of $449m (2013 $383m, 2012 $437m) are borne by those hotels.
2014
$m
2013
$m
2012
$m
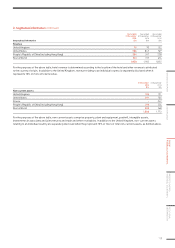
Directors’ emoluments
Base salaries, fees, performance payments and benefits¹9.0 8.5 9.7
Pension benefits under defined contribution plans 0.2 0.4 0.2
¹ Excludes ICETUS cash-out payment of £9.4m (see Directors’ Remuneration Report, page 85).
More detailed information on the emoluments, pensions, option holdings and shareholdings for each Director is shown in the Directors’
Remuneration Report on pages 76 to 91.
4. Auditor’s remuneration paid to Ernst & Young LLP
2014
$m
2013
$m
2012
$m
Audit of the Financial Statements 2.4 2.0 2.8
Audit of subsidiaries 2.0 1.4 1.5
Audit-related assurance services 0.2 0.5 1.0
Other assurance services 0.9 1.2 1.4
Tax compliance 0.2 0.2 0.3
Tax advisory 0.3 0.4 0.2
Other non-audit services not covered by the above 0.1 0.1 –
6.1 5.8 7.2
Audit fees in respect of the pension scheme were not material.
continuedNotes to the Group Financial Statements
IHG Annual Report and Form 20-F 2014
120