Holiday Inn 2014 Annual Report Download - page 139
Download and view the complete annual report
Please find page 139 of the 2014 Holiday Inn annual report below. You can navigate through the pages in the report by either clicking on the pages listed below, or by using the keyword search tool below to find specific information within the annual report.-
 1
1 -
2
-
3
-
4
-
5
-
6
-
7
-
8
-
9
-
10
-
11
-
12
-
13
-
14
-
15
-
16
-
17
-
18
-
19
-
20
-
21
-
22
-
23
-
24
-
25
-
26
-
27
-
28
-
29
-
30
-
31
-
32
-
33
-
34
-
35
-
36
-
37
-
38
-
39
-
40
-
41
-
42
-
43
-
44
-
45
-
46
-
47
-
48
-
49
-
50
-
51
-
52
-
53
-
54
-
55
-
56
-
57
-
58
-
59
-
60
-
61
-
62
-
63
-
64
-
65
-
66
-
67
-
68
-
69
-
70
-
71
-
72
-
73
-
74
-
75
-
76
-
77
-
78
-
79
-
80
-
81
-
82
-
83
-
84
-
85
-
86
-
87
-
88
-
89
-
90
-
91
-
92
-
93
-
94
-
95
-
96
-
97
-
98
-
99
-
100
-
101
-
102
-
103
-
104
-
105
-
106
-
107
-
108
-
109
-
110
-
111
-
112
-
113
-
114
-
115
-
116
-
117
-
118
-
119
-
120
-
121
-
122
-
123
-
124
-
125
-
126
-
127
-
128
-
 129
129 -
 130
130 -
 131
131 -
 132
132 -
 133
133 -
 134
134 -
 135
135 -
 136
136 -
 137
137 -
 138
138 -
 139
139 -
 140
140 -
 141
141 -
 142
142 -
 143
143 -
 144
144 -
 145
145 -
 146
146 -
 147
147 -
 148
148 -
 149
149 -
150
-
151
-
152
-
153
-
154
-
155
-
156
-
157
-
158
-
159
-
160
-
161
-
162
-
163
-
164
-
165
-
166
-
167
-
168
-
169
-
170
-
171
-
172
-
173
-
174
-
175
-
176
-
177
-
178
-
179
-
180
-
181
-
182
-
183
-
184
-
185
-
186
-
187
-
188
-
189
-
190
 |
 |

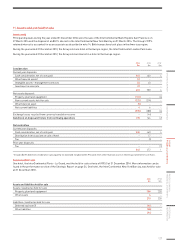
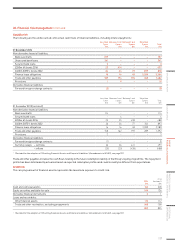
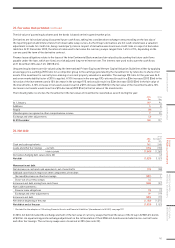
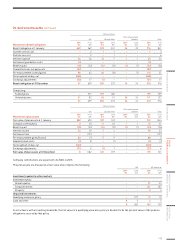
20. Financial risk management continued
Liquidity risk
The following are the undiscounted contractual cash flows of financial liabilities, including interest payments:
Less than
1 year
$m
Between 1 and
2 years
$m
Between 2 and
5 years
$m
More than
5 years
$m
Total
$m
31 December 2014
Non-derivative financial liabilities:
Bank overdrafts 107 –––107
Unsecured bank loans 361 –––361
Secured bank loans 3–––3
£250m 6% bonds 2016 23 414 – – 437
£400m 3.875% bonds 2022 24 24 73 697 818
Finance lease obligations 16 16 48 3,284 3,364
Trade and other payables 769 174 194 345 1,482
Provisions 19––10
Derivative financial liabilities:
Forward foreign exchange contracts (2) –––(2)
Less than
1 year
$m
Between 1 and
2 years
$m
Between 2 and
5 years
$m
More than
5 years
$m
Total
$m
31 December 2013 (restated1)
Non-derivative financial liabilities:
Bank overdrafts 114 –––114
Secured bank loans –4––4
£250m 6% bonds 2016 25 25 438 –488
£400m 3.875% bonds 2022 26 26 77 764 893
Finance lease obligations 16 16 48 3,300 3,380
Trade and other payables 748 162 193 289 1,392
Provisions 3–––3
Derivative financial liabilities:
Forward foreign exchange contracts (1) –––(1)
Currency swaps – outflows 26 26 441 –493
– inflows (25) (25) (438) –(488)
1 Restated for the adoption of ‘Offsetting Financial Assets and Financial Liabilities’ (Amendments to IAS 32), see page 107.
Trade and other payables includes the cash flows relating to the future redemption liability of the Group’s loyalty programme. The repayment
profile has been determined by actuaries based on expected redemption profiles and could in reality be different from expectations.
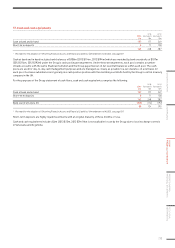
Credit risk
The carrying amount of financial assets represents the maximum exposure to credit risk.
2014
$m
2013
(restated1)
$m
Cash and cash equivalents 162 248
Equity securities available-for-sale 144 136
Derivative financial instruments 21
Loans and receivables:
Other financial assets 113 112
Trade and other receivables, excluding prepayments 388 358
809 855
1 Restated for the adoption of ‘Offsetting Financial Assets and Financial Liabilities’ (Amendments to IAS 32), see page 107.
STRATEGIC REPORT GOVERNANCE
GROUP
FINANCIAL STATEMENTS
PARENT COMPANY
FINANCIAL STATEMENTS
ADDITIONAL
INFORMATION
137