Holiday Inn 2014 Annual Report Download - page 5
Download and view the complete annual report
Please find page 5 of the 2014 Holiday Inn annual report below. You can navigate through the pages in the report by either clicking on the pages listed below, or by using the keyword search tool below to find specific information within the annual report.-
 1
1 -
 2
2 -
 3
3 -
 4
4 -
 5
5 -
 6
6 -
 7
7 -
 8
8 -
 9
9 -
 10
10 -
 11
11 -
 12
12 -
 13
13 -
 14
14 -
 15
15 -
 16
16 -
17
-
18
-
19
-
20
-
21
-
22
-
23
-
24
-
25
-
26
-
27
-
28
-
29
-
30
-
31
-
32
-
33
-
34
-
35
-
36
-
37
-
38
-
39
-
40
-
41
-
42
-
43
-
44
-
45
-
46
-
47
-
48
-
49
-
50
-
51
-
52
-
53
-
54
-
55
-
56
-
57
-
58
-
59
-
60
-
61
-
62
-
63
-
64
-
65
-
66
-
67
-
68
-
69
-
70
-
71
-
72
-
73
-
74
-
75
-
76
-
77
-
78
-
79
-
80
-
81
-
82
-
83
-
84
-
85
-
86
-
87
-
88
-
89
-
90
-
91
-
92
-
93
-
94
-
95
-
96
-
97
-
98
-
99
-
100
-
101
-
102
-
103
-
104
-
105
-
106
-
107
-
108
-
109
-
110
-
111
-
112
-
113
-
114
-
115
-
116
-
117
-
118
-
119
-
120
-
121
-
122
-
123
-
124
-
125
-
126
-
127
-
128
-
129
-
130
-
131
-
132
-
133
-
134
-
135
-
136
-
137
-
138
-
139
-
140
-
141
-
142
-
143
-
144
-
145
-
146
-
147
-
148
-
149
-
150
-
151
-
152
-
153
-
154
-
155
-
156
-
157
-
158
-
159
-
160
-
161
-
162
-
163
-
164
-
165
-
166
-
167
-
168
-
169
-
170
-
171
-
172
-
173
-
174
-
175
-
176
-
177
-
178
-
179
-
180
-
181
-
182
-
183
-
184
-
185
-
186
-
187
-
188
-
189
-
190
 |
 |

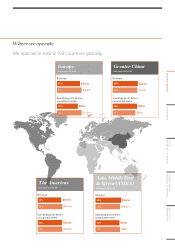
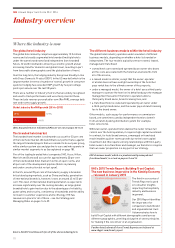
We operate in nearly 100countries globally.
$400m§
$374m
2013
Operating profit before
exceptional items
Revenue
2014
$105m§
$89m
2013
2014
Europe
See pages 40 to 42
$236m
$242m
2013
Operating profit before
exceptional items
Revenue
2014
$82m
$89m
2013
2014
Greater China
See pages 46 to 48
$230m§
$242m
2013
Operating profit before
exceptional items
Revenue
2014
$86m§
$84m
2013
2014
Asia, Middle East
& Africa (AMEA)
See pages 43 to 45
$916m§
$871m‡
2013
Operating profit before
exceptional items
Revenue
2014
$550m§
$544m‡
2013
2014
The Americas
See pages 37 to 39
Where we operate
3
STRATEGIC REPORT GOVERNANCE
GROUP
FINANCIAL STATEMENTS
ADDITIONAL
INFORMATION
PARENT COMPANY
FINANCIAL STATEMENTS