Holiday Inn 2014 Annual Report Download - page 179
Download and view the complete annual report
Please find page 179 of the 2014 Holiday Inn annual report below. You can navigate through the pages in the report by either clicking on the pages listed below, or by using the keyword search tool below to find specific information within the annual report.-
 1
1 -
2
-
3
-
4
-
5
-
6
-
7
-
8
-
9
-
10
-
11
-
12
-
13
-
14
-
15
-
16
-
17
-
18
-
19
-
20
-
21
-
22
-
23
-
24
-
25
-
26
-
27
-
28
-
29
-
30
-
31
-
32
-
33
-
34
-
35
-
36
-
37
-
38
-
39
-
40
-
41
-
42
-
43
-
44
-
45
-
46
-
47
-
48
-
49
-
50
-
51
-
52
-
53
-
54
-
55
-
56
-
57
-
58
-
59
-
60
-
61
-
62
-
63
-
64
-
65
-
66
-
67
-
68
-
69
-
70
-
71
-
72
-
73
-
74
-
75
-
76
-
77
-
78
-
79
-
80
-
81
-
82
-
83
-
84
-
85
-
86
-
87
-
88
-
89
-
90
-
91
-
92
-
93
-
94
-
95
-
96
-
97
-
98
-
99
-
100
-
101
-
102
-
103
-
104
-
105
-
106
-
107
-
108
-
109
-
110
-
111
-
112
-
113
-
114
-
115
-
116
-
117
-
118
-
119
-
120
-
121
-
122
-
123
-
124
-
125
-
126
-
127
-
128
-
129
-
130
-
131
-
132
-
133
-
134
-
135
-
136
-
137
-
138
-
139
-
140
-
141
-
142
-
143
-
144
-
145
-
146
-
147
-
148
-
149
-
150
-
151
-
152
-
153
-
154
-
155
-
156
-
157
-
158
-
159
-
160
-
161
-
162
-
163
-
164
-
165
-
166
-
167
-
168
-
 169
169 -
 170
170 -
 171
171 -
 172
172 -
 173
173 -
 174
174 -
 175
175 -
 176
176 -
 177
177 -
 178
178 -
 179
179 -
 180
180 -
 181
181 -
 182
182 -
 183
183 -
 184
184 -
 185
185 -
 186
186 -
 187
187 -
 188
188 -
 189
189 -
190
 |
 |

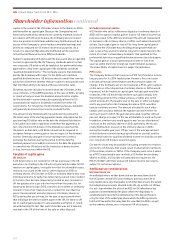
Share price information
The principal trading market for the Company’s ordinary shares is the London Stock Exchange (LSE). The ordinary shares are also listed
on the NYSE trading in the form of ADSs evidenced by ADRs. Each ADS represents one ordinary share. The Company has a sponsored
ADR facility with JPMorgan as ADR Depositary. The following table shows, for the financial periods indicated, the reported high and low
middle market quotations (which represent an average of closing bid and ask prices) for the ordinary shares on the LSE, as derived from
the Official List of the UK Listing Authority, and the highest and lowest sales prices of the ADSs as reported on the NYSE composite tape.
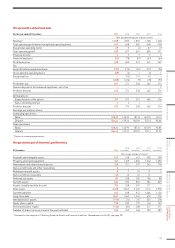
£ per ordinary share $ per ADS1
Year ended 31 December high low high low
2010 12.66 8.87 20.04 13.84
2011 14.35 9.55 23.28 15.27
2012 17.25 11.57 27.82 17.99
2013 20.39 17.07 33.54 26.90
2014 27.10 18.66 42.51 30.88
Quarters in the year ended 31 December
2013
First quarter 20.22 17.07 30.64 27.82
Second quarter 20.39 17.37 30.61 26.90
Third quarter 20.30 17.88 31.08 27.77
Fourth quarter 20.25 17.63 33.54 28.27
2014
First quarter 20.47 18.66 34.08 30.88
Second quarter 24.21 19.04 41.51 31.60
Third quarter 24.75 21.99 42.51 36.84
Fourth quarter 27.10 21.20 42.38 34.03
2015
First quarter (to 16 February 2015) 27.56 25.33 41.57 38.32
Month ended
August 2014 23.75 21.99 40.02 37.15
September 2014 24.45 22.85 39.85 36.84
October 2014 23.69 21.20 38.01 34.03
November 2014 27.10 24.03 42.38 38.25
December 2014 26.39 24.17 41.30 37.63
January 2015 27.56 25.33 41.57 38.32
February 2015 (to 16 February 2015) 26.76 25.88 41.37 39.24
1
Fluctuations in the exchange rates between sterling and the US dollar will affect the dollar equivalent of the sterling price of the ordinary shares on the LSE
and, as a result, are likely to affect the market price of ADSs.
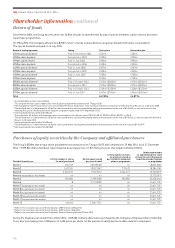
Dividend history
The table below sets forth the amounts of ordinary dividends on each ordinary share and special dividends, in respect of each financial
year indicated.
Interim dividend Final dividend Total dividend Special dividend
pence cents pence cents pence cents pence cents
2014 14.8 25.0 33.8 52.0 48.6 77.0 174.91293.01
2013 15.1 23.0 28.1 47.0 43.2 70.0 87.1 133.0
2012 13.5 21.0 27.7 43.0 41.2 64.0 108.41172.01
2011 9.8 16.0 24.7 39.0 34.5 55.0 – –
2010 8.0 12.8 22.0 35.2 30.0 48.0 – –
2009 7.3 12.2 18.7 29.2 26.0 41.4 – –
200826.4 12.2 20.2 29.2 26.6 41.4 – –
2007 5.7 11.5 14.9 29.2 20.6 40.7 2001–
2006 5.1 9.6 13.3 25.9 18.4 35.5 1181–
2005 4.6 8.1 10.7 18.7 15.3 26.8 – –
2004 4.3 7.7 10.0 19.1 14.3 26.8 72.01–
2003 4.05 6.8 9.45 17.4 13.5 24.2 – –
1
Accompanied by a share consolidation.
2
IHG changed the reporting currency of its Consolidated Financial Statements from sterling to US dollars effective from the Half-Year Results as at 30 June 2008.
Starting with the interim dividend for 2008, all dividends have first been determined in US dollars and converted into sterling immediately before announcement.
177
STRATEGIC REPORT GOVERNANCE
GROUP
FINANCIAL STATEMENTS
PARENT COMPANY
FINANCIAL STATEMENTS
ADDITIONAL
INFORMATION