Holiday Inn 2014 Annual Report Download - page 120
Download and view the complete annual report
Please find page 120 of the 2014 Holiday Inn annual report below. You can navigate through the pages in the report by either clicking on the pages listed below, or by using the keyword search tool below to find specific information within the annual report.-
 1
1 -
2
-
3
-
4
-
5
-
6
-
7
-
8
-
9
-
10
-
11
-
12
-
13
-
14
-
15
-
16
-
17
-
18
-
19
-
20
-
21
-
22
-
23
-
24
-
25
-
26
-
27
-
28
-
29
-
30
-
31
-
32
-
33
-
34
-
35
-
36
-
37
-
38
-
39
-
40
-
41
-
42
-
43
-
44
-
45
-
46
-
47
-
48
-
49
-
50
-
51
-
52
-
53
-
54
-
55
-
56
-
57
-
58
-
59
-
60
-
61
-
62
-
63
-
64
-
65
-
66
-
67
-
68
-
69
-
70
-
71
-
72
-
73
-
74
-
75
-
76
-
77
-
78
-
79
-
80
-
81
-
82
-
83
-
84
-
85
-
86
-
87
-
88
-
89
-
90
-
91
-
92
-
93
-
94
-
95
-
96
-
97
-
98
-
99
-
100
-
101
-
102
-
103
-
104
-
105
-
106
-
107
-
108
-
109
-
 110
110 -
 111
111 -
 112
112 -
 113
113 -
 114
114 -
 115
115 -
 116
116 -
 117
117 -
 118
118 -
 119
119 -
 120
120 -
 121
121 -
 122
122 -
 123
123 -
 124
124 -
 125
125 -
 126
126 -
 127
127 -
 128
128 -
 129
129 -
 130
130 -
131
-
132
-
133
-
134
-
135
-
136
-
137
-
138
-
139
-
140
-
141
-
142
-
143
-
144
-
145
-
146
-
147
-
148
-
149
-
150
-
151
-
152
-
153
-
154
-
155
-
156
-
157
-
158
-
159
-
160
-
161
-
162
-
163
-
164
-
165
-
166
-
167
-
168
-
169
-
170
-
171
-
172
-
173
-
174
-
175
-
176
-
177
-
178
-
179
-
180
-
181
-
182
-
183
-
184
-
185
-
186
-
187
-
188
-
189
-
190
 |
 |

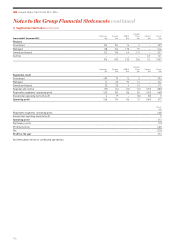
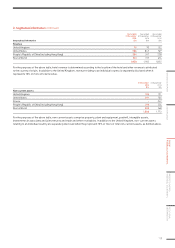
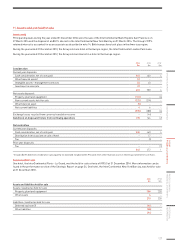
2. Segmental information continued
Year ended 31 December 2012
Americas
$m
Europe
$m
AMEA
$m
Greater
China
$m
Central
$m
Group
$m
Revenue
Franchised 541 91 18 3 – 653
Managed 97 147 152 89 –485
Owned and leased 199 198 48 138 –583
Central ––––114 114
837 436 218 230 114 1,835
Americas
$m
Europe
$m
AMEA
$m
Greater
China
$m
Central
$m
Group
$m
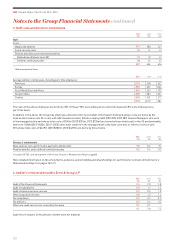
Segmental result
Franchised 466 65 12 4 – 547
Managed 48 32 90 51 –221
Owned and leased 24 50 645 –125
Regional and central (52) (35) (20) (19) (162) (288)
Reportable segments’ operating profit 486 112 88 81 (162) 605
Exceptional operating items (note 5) 23 (4) (5) –(18) (4)
Operating profit 509 108 83 81 (180) 601
Group
$m
Reportable segments’ operating profit 605
Exceptional operating items (note 5) (4)
Operating profit 601
Net finance costs (54)
Profit before tax 547
Tax (9)
Profit for the year 538
All items above relate to continuing operations.
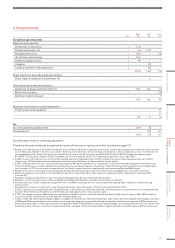
Year ended 31 December 2012
Americas
$m
Europe
$m
AMEA
$m
Greater
China
$m
Central
$m
Group
$m
Other segmental information
Capital expenditure 25 19 6 7 76 133
Non-cash items:
Depreciation and amortisation120 23 14 15 22 94
Reversal of previously recorded impairment (23) ––––(23)
Write-off of software ––––18 18
Demerger liability released ––––(9) (9)
Share-based payments cost ––––22 22
Share of profits of associates and joint ventures – – (3) – – (3)
1 Included in the $94m of depreciation and amortisation is $31m relating to administrative expenses and $63m relating to cost of sales.
continuedNotes to the Group Financial Statements
IHG Annual Report and Form 20-F 2014
118