Holiday Inn 2014 Annual Report Download - page 44
Download and view the complete annual report
Please find page 44 of the 2014 Holiday Inn annual report below. You can navigate through the pages in the report by either clicking on the pages listed below, or by using the keyword search tool below to find specific information within the annual report.-
 1
1 -
2
-
3
-
4
-
5
-
6
-
7
-
8
-
9
-
10
-
11
-
12
-
13
-
14
-
15
-
16
-
17
-
18
-
19
-
20
-
21
-
22
-
23
-
24
-
25
-
26
-
27
-
28
-
29
-
30
-
31
-
32
-
33
-
 34
34 -
 35
35 -
 36
36 -
 37
37 -
 38
38 -
 39
39 -
 40
40 -
 41
41 -
 42
42 -
 43
43 -
 44
44 -
 45
45 -
 46
46 -
 47
47 -
 48
48 -
 49
49 -
 50
50 -
 51
51 -
 52
52 -
 53
53 -
 54
54 -
55
-
56
-
57
-
58
-
59
-
60
-
61
-
62
-
63
-
64
-
65
-
66
-
67
-
68
-
69
-
70
-
71
-
72
-
73
-
74
-
75
-
76
-
77
-
78
-
79
-
80
-
81
-
82
-
83
-
84
-
85
-
86
-
87
-
88
-
89
-
90
-
91
-
92
-
93
-
94
-
95
-
96
-
97
-
98
-
99
-
100
-
101
-
102
-
103
-
104
-
105
-
106
-
107
-
108
-
109
-
110
-
111
-
112
-
113
-
114
-
115
-
116
-
117
-
118
-
119
-
120
-
121
-
122
-
123
-
124
-
125
-
126
-
127
-
128
-
129
-
130
-
131
-
132
-
133
-
134
-
135
-
136
-
137
-
138
-
139
-
140
-
141
-
142
-
143
-
144
-
145
-
146
-
147
-
148
-
149
-
150
-
151
-
152
-
153
-
154
-
155
-
156
-
157
-
158
-
159
-
160
-
161
-
162
-
163
-
164
-
165
-
166
-
167
-
168
-
169
-
170
-
171
-
172
-
173
-
174
-
175
-
176
-
177
-
178
-
179
-
180
-
181
-
182
-
183
-
184
-
185
-
186
-
187
-
188
-
189
-
190
 |
 |

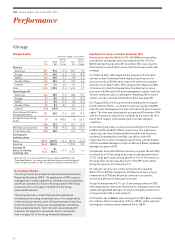
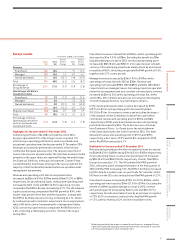
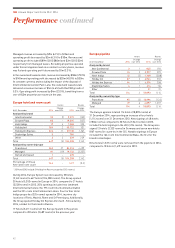
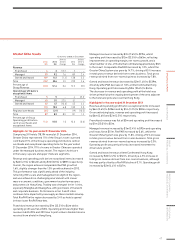
Managed revenue increased by $9m (6.1%) to $156m and
operating profit decreased by $2m (6.3%) to $30m. Revenue and
operating profit included $89m (2012 $80m) and $2m (2012 $2m)
respectively from managed leases. Excluding properties operated
under this arrangement and on a constant currency basis, revenue
was flat and operating profit decreased by $1m (3.3%).
In the owned and leased estate, revenue decreased by $58m (29.3%)
to $140m and operating profit decreased by $20m (40.0%) to $30m.
At constant currency and excluding the impact of the disposal of
InterContinental London Park Lane, the owned and leased estate
delivered a revenue increase of $5m (4.6%) with RevPAR growth of
5.3%. Operating profit increased by $4m (23.5%), benefiting from a
one-off $3m property tax recovery in the year.
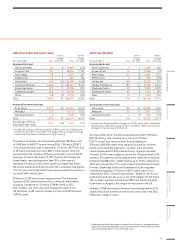
Europe hotel and room count
Hotels Rooms
At 31 December 2014
Change
over 2013 2014
Change
over 2013
Analysed by brand
InterContinental 30 (1) 9,372 (153)
Crowne Plaza 83 –19,395 (127)
Hotel Indigo 17 41,568 325
Holiday Inn1284 245,722 101
Holiday Inn Express 226 11 27,138 1,767
Staybridge Suites 5–784 –
Other 22229 229
Total 647 18 104,208 2,142
Analysed by ownership type
Franchised 565 37 84,016 4,499
Managed 81 (19) 19,722 (2,357)
Owned and leased 1–470 –
Total 647 18 104,208 2,142
Percentage of Group
hotel and room count 13.4 –14.7 (0.2)
1 2014 and 2013 include 2 Holiday Inn Resort properties (212 rooms).
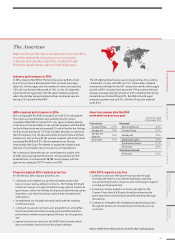
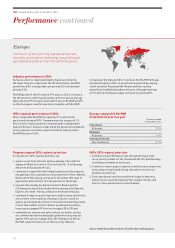
During 2014, Europe System size increased by 18 hotels
(2,142 rooms) to 647 hotels (104,208 rooms). The Group opened
35 hotels (5,353 rooms) in Europe in 2014, compared to 21 hotels
(3,528 rooms) in 2013. 2014 openings included two landmark
InterContinental hotels; the 197-room InterContinental Dublin
and the 331-room InterContinental Lisbon. Four further Hotel
Indigo properties (325 rooms) opened in 2014, in prime city
locations of Paris, Madrid, Rome and St Petersburg. Additionally,
the Group opened Holiday Inn Express Voronezh - Kirova during
2014, a debut for the brand in Russia.
17 hotels (3,211 rooms) left the Europe System in the period,
compared to 20 hotels (3,489 rooms) in the previous year.
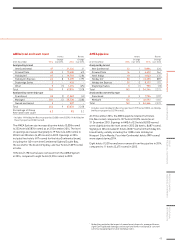
Europe pipeline
Hotels Rooms
At 31 December 2014
Change
over 2013 2014
Change
over 2013
Analysed by brand
InterContinental 31845 192
Crowne Plaza 14 22,917 293
Hotel Indigo 12 (3) 1,368 (208)
Holiday Inn 37 26,944 332
Holiday Inn Express 44 16,374 358
Staybridge Suites 41414 116
Other ––31 31
Total 114 418,893 1,114
Analysed by ownership type
Franchised 95 (2) 13,996 (123)
Managed 19 64,897 1,237
Total 114 418,893 1,114
The Europe pipeline totalled 114 hotels (18,893 rooms) at
31 December 2014, representing an increase of four hotels
(1,114 rooms) over 31 December 2013. New signings of 48 hotels
(7,804 rooms), compared to 50 hotels (7,542 rooms) in 2013,
included 16 hotel signings in the UK (2,234 rooms). The Group also
signed 12 hotels (2,323 rooms) in Germany and seven new hotels
(867 rooms) in countries in the CIS. Notable signings in Europe
included the 162-room InterContinental Baku, the first for the
brand in Azerbaijan.
Nine hotels (1,337 rooms) were removed from the pipeline in 2014,
compared to 10 hotels (1,419 rooms) in 2013.
42
IHG Annual Report and Form 20-F 2014
Performance continued