Holiday Inn 2014 Annual Report Download - page 177
Download and view the complete annual report
Please find page 177 of the 2014 Holiday Inn annual report below. You can navigate through the pages in the report by either clicking on the pages listed below, or by using the keyword search tool below to find specific information within the annual report.-
 1
1 -
2
-
3
-
4
-
5
-
6
-
7
-
8
-
9
-
10
-
11
-
12
-
13
-
14
-
15
-
16
-
17
-
18
-
19
-
20
-
21
-
22
-
23
-
24
-
25
-
26
-
27
-
28
-
29
-
30
-
31
-
32
-
33
-
34
-
35
-
36
-
37
-
38
-
39
-
40
-
41
-
42
-
43
-
44
-
45
-
46
-
47
-
48
-
49
-
50
-
51
-
52
-
53
-
54
-
55
-
56
-
57
-
58
-
59
-
60
-
61
-
62
-
63
-
64
-
65
-
66
-
67
-
68
-
69
-
70
-
71
-
72
-
73
-
74
-
75
-
76
-
77
-
78
-
79
-
80
-
81
-
82
-
83
-
84
-
85
-
86
-
87
-
88
-
89
-
90
-
91
-
92
-
93
-
94
-
95
-
96
-
97
-
98
-
99
-
100
-
101
-
102
-
103
-
104
-
105
-
106
-
107
-
108
-
109
-
110
-
111
-
112
-
113
-
114
-
115
-
116
-
117
-
118
-
119
-
120
-
121
-
122
-
123
-
124
-
125
-
126
-
127
-
128
-
129
-
130
-
131
-
132
-
133
-
134
-
135
-
136
-
137
-
138
-
139
-
140
-
141
-
142
-
143
-
144
-
145
-
146
-
147
-
148
-
149
-
150
-
151
-
152
-
153
-
154
-
155
-
156
-
157
-
158
-
159
-
160
-
161
-
162
-
163
-
164
-
165
-
166
-
 167
167 -
 168
168 -
 169
169 -
 170
170 -
 171
171 -
 172
172 -
 173
173 -
 174
174 -
 175
175 -
 176
176 -
 177
177 -
 178
178 -
 179
179 -
 180
180 -
 181
181 -
 182
182 -
 183
183 -
 184
184 -
 185
185 -
 186
186 -
 187
187 -
188
-
189
-
190
 |
 |

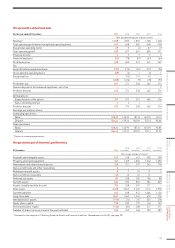
Group income statement data
For the year ended 31 December 2014 2013 2012 2011 2010
($m, except earnings per ordinary share)
Revenue11,858 1,903 1,835 1,768 1,628
Total operating profit before exceptional operating items 651 668 605 548 438
Exceptional operating items129 5(4) 57 (7)
Total operating profit1680 673 601 605 431
Financial income 35322
Financial expenses (83) (78) (57) (64) (64)
Profit before tax 600 600 547 543 369
Tax:
On profit before exceptional items (179) (175) (151) (117) (96)
On exceptional operating items (29) (6) 1(4) 1
Exceptional tax –(45) 141 43 –
(208) (226) (9) (78) (95)
Profit after tax: 392 374 538 465 274
Gain on disposal of discontinued operations, net of tax ––––2
Profit for the year 392 374 538 465 276
Attributable to:
Equity holders of the parent 391 372 537 465 276
Non-controlling interest 121––
Profit for the year 392 374 538 465 276
Earnings per ordinary share:
Continuing operations:
Basic 158.3¢ 140.9¢ 187.1¢ 160.9¢ 95.1¢
Diluted 156.4¢ 139.3¢ 183.9¢ 157.1¢ 92.6¢
Total operations:
Basic 158.3¢ 140.9¢ 187.1¢ 160.9¢ 95.8¢
Diluted 156.4¢ 139.3¢ 183.9¢ 157.1¢ 93.2¢
1 Relates to continuing operations.
Group statement of financial position data
31 December 2014
2013
(restated1)
2012
(restated1)
2011
(restated1)
2010
(restated1)
($m, except number of shares)
Goodwill and intangible assets 643 518 447 400 358
Property, plant and equipment 741 1,169 1,056 1,362 1,690
Investments and other financial assets 368 321 239 243 178
Non-current trade and other receivables 3––––
Retirement benefit assets 8799 21 5
Non-current tax receivable 34 16 24 41 –
Deferred tax assets 87 108 204 106 88
Current assets 624 700 852 784 659
Assets classified as held for sale 310 228 534 217 –
Total assets 2,818 3,067 3,455 3,174 2,978
Current liabilities 943 928 972 1,066 1,136
Long-term debt 1,569 1,269 1,242 670 776
Net (liabilities) / assets (717) (74) 317 555 278
Equity share capital 178 189 179 162 155
IHG shareholders’ equity (725) (82) 308 547 271
Number of shares in issue at end of the year (millions) 248 269 268 290 289
1 Restated for the adoption of ‘Offsetting Financial Assets and Financial Liabilities’ (Amendments to IAS 32), see page 107.
175
STRATEGIC REPORT GOVERNANCE
GROUP
FINANCIAL STATEMENTS
PARENT COMPANY
FINANCIAL STATEMENTS
ADDITIONAL
INFORMATION