Holiday Inn 2014 Annual Report Download - page 46
Download and view the complete annual report
Please find page 46 of the 2014 Holiday Inn annual report below. You can navigate through the pages in the report by either clicking on the pages listed below, or by using the keyword search tool below to find specific information within the annual report.-
 1
1 -
2
-
3
-
4
-
5
-
6
-
7
-
8
-
9
-
10
-
11
-
12
-
13
-
14
-
15
-
16
-
17
-
18
-
19
-
20
-
21
-
22
-
23
-
24
-
25
-
26
-
27
-
28
-
29
-
30
-
31
-
32
-
33
-
34
-
35
-
 36
36 -
 37
37 -
 38
38 -
 39
39 -
 40
40 -
 41
41 -
 42
42 -
 43
43 -
 44
44 -
 45
45 -
 46
46 -
 47
47 -
 48
48 -
 49
49 -
 50
50 -
 51
51 -
 52
52 -
 53
53 -
 54
54 -
 55
55 -
 56
56 -
57
-
58
-
59
-
60
-
61
-
62
-
63
-
64
-
65
-
66
-
67
-
68
-
69
-
70
-
71
-
72
-
73
-
74
-
75
-
76
-
77
-
78
-
79
-
80
-
81
-
82
-
83
-
84
-
85
-
86
-
87
-
88
-
89
-
90
-
91
-
92
-
93
-
94
-
95
-
96
-
97
-
98
-
99
-
100
-
101
-
102
-
103
-
104
-
105
-
106
-
107
-
108
-
109
-
110
-
111
-
112
-
113
-
114
-
115
-
116
-
117
-
118
-
119
-
120
-
121
-
122
-
123
-
124
-
125
-
126
-
127
-
128
-
129
-
130
-
131
-
132
-
133
-
134
-
135
-
136
-
137
-
138
-
139
-
140
-
141
-
142
-
143
-
144
-
145
-
146
-
147
-
148
-
149
-
150
-
151
-
152
-
153
-
154
-
155
-
156
-
157
-
158
-
159
-
160
-
161
-
162
-
163
-
164
-
165
-
166
-
167
-
168
-
169
-
170
-
171
-
172
-
173
-
174
-
175
-
176
-
177
-
178
-
179
-
180
-
181
-
182
-
183
-
184
-
185
-
186
-
187
-
188
-
189
-
190
 |
 |

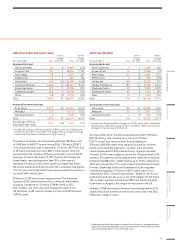
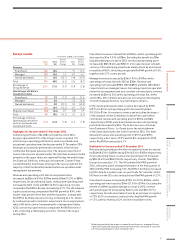
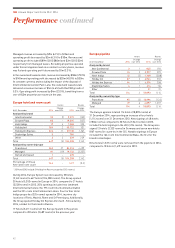
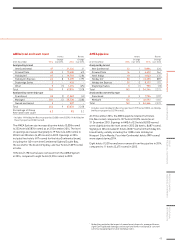
AMEA results
12 months ended 31 December
2014
$m
2013
$m
2014 vs
2013 %
change
2012
$m
2013 vs
2012 %
change
Revenue
Franchised 16 16 –18 (11.1)
Managed 187 170 10.0 152 11.8
Owned and leased 39 44 (11.4) 48 (8.3)
Total 242 230 5.2 218 5.5
Percentage of
Group Revenue 13.0 12.1 0.9 11.9 0.2
Operating profit before
exceptional items
Franchised 12 12 –12 –
Managed 88 92 (4.3) 90 2.2
Owned and leased 34(25.0) 6(33.3)
103 108 (4.6) 108 –
Regional overheads (19) (22) 13.6 (20) (10.0)
Total 84 86 (2.3) 88 (2.3)
Percentage of Group
Operating profit before
central overheads and
exceptional items
10.5 10.4 0.1 11.5 (1.1)
Highlights for the year ended 31December 2014
Comprising 253 hotels (67,876 rooms) at 31 December 2014,
AMEA represented 9% of the Group’s room count and contributed
10% of the Group’s operating profit before central overheads
and exceptional operating items during the year. 82% of rooms
in AMEA are operated under the managed business model.
The region’s hotels are in the luxury, upscale and upper
midscale segments.
Revenue increased by $12m (5.2%) to $242m whilst operating
profit before exceptional items decreased by $2m (2.3%) to
$84m. On an underlying1 basis, revenue increased by $5m
(2.5%) and operating profit increased by $4m (5.1%). The results
included a $6m benefit from liquidated damages received in
2013 (2014 $nil). AMEA is a geographically diverse region and
performance was impacted by political and economic factors
affecting different countries.
Comparable RevPAR increased 3.8% driven by 2.4% rate growth.
Performance was led by the Middle East, up 5.6%, driven by a solid
performance in Saudi Arabia and a recovery in Egypt. This was
supported by positive trading in the mature markets of Japan,
which grew by 6.7%, and Australia, which grew by 3.9%.
Elsewhere, both India and South East Asia exhibited steady
growth, with the exception of Thailand which suffered from
political instability in the first half of the year.
Franchised revenue and operating profit remained flat at $16m
and $12m respectively.
Managed revenue increased by $17m (10.0%) to $187m whilst
operating profit decreased by $4m (4.3%) to $88m. Revenue and
operating profit included $41m (2013 $21m) and $4m (2013 $1m)
respectively from one managed lease property. Excluding results
from this hotel, as well as the benefit of $6m liquidated damages
in 2013 (2014 $nil), revenue increased by $7m (4.9%) whilst
operating profit increased by $2m (2.4%) on a constant currency
basis. Comparable RevPAR increased by 4.4%, with room count
increasing by 5.9%.
In the owned and leased estate, revenue and operating profit
decreased by $5m (11.4%) to $39m and by $1m (25.0%) to $3m
respectively, due to a 6.3% decrease in RevPAR.
Highlights for the year ended 31December 2013
Revenue increased by $12m (5.5%) to $230m and operating
profit decreased by $2m (2.3%) to $86m. On an underlying1 basis,
revenue and operating profit decreased by $6m (2.8%) and
$7m (8.0%) respectively. The results included a $6m benefit
from liquidated damages in 2013 (2012 $nil). RevPAR increased
by 6.1%, with 3.0% growth in average daily rate. AMEA is a
geographically diverse region and performance is impacted
by political and economic factors affecting different countries.
The Middle East delivered RevPAR growth of 2.9%, driven by
strength in the United Arab Emirates and Saudi Arabia, whilst
continuing political uncertainty impacted some of our other markets
in the region, particularly Egypt and Lebanon. Performance in
Japan was strong, with RevPAR increasing by 9.6%, whilst Australia
also achieved solid RevPAR growth of 2.8%. RevPAR growth in
developing markets remained buoyant, led by 12.2% RevPAR
growth in Indonesia. Revenue and operating profit growth were
muted by a $6m negative year-on-year impact from the renewal
of a small number of long-standing contracts onto current
commercial terms. In addition, there was a $4m negative impact
from similar contracts that were not renewed.
Franchised revenue decreased by $2m (11.1%) to $16m, whilst
operating profit was flat at $12m.
Managed revenue and operating profit increased by $18m (11.8%)
to $170m and by $2m (2.2%) to $92m respectively. During 2013,
a new property opened under an operating lease structure, with
the same characteristics as a management contract, contributing
revenue of $21m and operating profit of $1m. Excluding this
property together with the benefit of the $6m liquidated damages
receipt in 2013, revenue and operating profit decreased by $4m
(2.6%) and $4m (4.4%) respectively at constant currency. RevPAR
increased by 5.6%, with AMEA System size up 2.6%.
In the owned and leased estate, revenue and operating profit
decreased by $4m (8.3%) to $44m and by $2m (33.3%) to $4m
respectively, driven by a 7.3% RevPAR decline.
44
IHG Annual Report and Form 20-F 2014
Performance continued