Dollar Tree 2006 Annual Report Download - page 5
Download and view the complete annual report
Please find page 5 of the 2006 Dollar Tree annual report below. You can navigate through the pages in the report by either clicking on the pages listed below, or by using the keyword search tool below to find specific information within the annual report.-
 1
1 -
 2
2 -
 3
3 -
 4
4 -
 5
5 -
 6
6 -
 7
7 -
 8
8 -
 9
9 -
 10
10 -
 11
11 -
 12
12 -
 13
13 -
 14
14 -
 15
15 -
 16
16 -
17
-
18
-
19
-
20
-
21
-
22
-
23
-
24
-
25
-
26
-
27
-
28
-
29
-
30
-
31
-
32
-
33
-
34
-
35
-
36
-
37
-
38
-
39
-
40
-
41
-
42
-
43
-
44
-
45
-
46
-
47
-
48
-
49
-
50
-
51
-
52
 |
 |

DOLLAR TREE STORES, INC. • 2006 ANNUAL REPORT 3
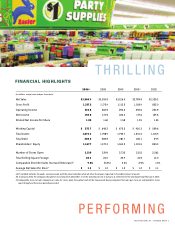
0605040302
13
17
20
23
26
TOTAL SELLING
SQUARE FOOTAGE
(In Millions)
0605040302
NUMBER OF
STORES OPEN
2,263
2,513
2,735
2,914
3,219
0605040302
2.3
2.8
3.1
3.4
4.0
NET SALES
($ In Billions)
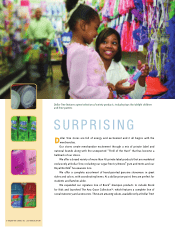
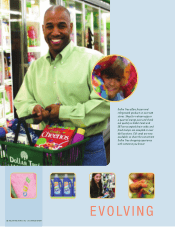
New promotions, such as our “Build a Gift Basket” and “Build a Wreath” encouraged multiple purchases
and exceeded our customers’ expectations with high value for their $1 and a fun shopping experience.
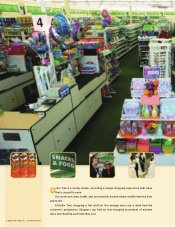
We benefited from increased sales of basic products; items that people need everyday and are
more frequently purchased. Our expanded product selection has been embraced by our customers
who are making more frequent shopping trips to our stores. Improved replenishment methods are
providing a better in-stock position on these products and we believe this has been a real driver of
increases in both customer traffic and our average ticket.
Our initiative to expand frozen and refrigerated product to more stores continues to yield positive
results. We added freezers and coolers to 392 stores in 2006, bringing our total to 632 stores at year-end,
compared with 240 stores at the beginning of the year. The margins on this product are a bit lower than
our average but this is a trade that we are willing to make. The fact is our customers love it! We are
attracting more customers to our stores more frequently with this product and it is resulting in incre-
mental sales. We are planning to roll freezers and coolers to an additional 250 stores in fiscal 2007.
We continue to refine our advertising, with increased emphasis on the holiday season. Using a
combination of radio and television in target markets, and tabloid advertisements at key seasons we
found a winning combination. The “Feature Item of the Week” program added energy and focus on
key items. We believe we are honing in on the appropriate mix of advertising and promotion required
to drive traffic and increased sales.
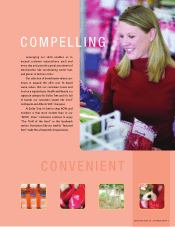
In 2005, we began to expand tender types for the added convenience of our customers. By the
middle of 2006, we completed the rollout of debit card and Electronic Benefits Transfer acceptance to
substantially all of our stores. This has provided a lift to our average ticket as well as traffic and will con-
tinue to do so in 2007 and beyond. In addition, with the rollout of frozen and refrigerated capability, at
year end we were accepting Food Stamps in about 600 stores. Last, but with great promise, we launched
a gift card program in the third quarter, just in time for the holidays.
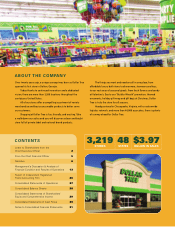
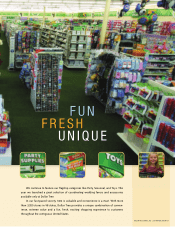
We continue to grow our store base, and refine our real estate process. Our goal is to open
stores earlier in the year, to maximize their productivity through improved site selection, improve
the construction process and ultimately to increase our return on invested capital. In fiscal 2006
we opened 211 new stores, expanded and relocated 85 existing stores, and increased retail square
footage 14%, including the Deal$ acquisition. Our new stores averaged 11,200 square feet, a size that
is within our targeted range, and ideal from the customers’ perspective, allowing them to see a full
display of merchandise in an open and bright shopping environment, while keeping their shopping
trip quick and convenient.
LEVERAGING OUR INFRASTRUCTURE
Significant investments in infrastructure over the past few years are contributing to improved
performance. Our logistics network is highly automated, efficient and capable of delivering product
to all 48 contiguous states and we have capacity to support growth to $5 billion without additional
investment. Our technology infrastructure, and particularly our investment in point-of-sale applications,
has given us the ability to improve our flow of product to stores, reduce back room inventory and
improve operating efficiency. Our Automated Store Replenishment tool is improving our in stock of
basics. Demand driven allocations of new product consistent with sales trends is driving store sales
and our sell through of seasonal product is increasing. In combination, these investments enabled us
to lower our inventory investment by 5% per store at fiscal 2006 year-end, following a 12% reduction
in inventory per store in 2005. Inventory turns increased an amazing 50 basis points in 2006!