Dollar Tree 2006 Annual Report Download - page 47
Download and view the complete annual report
Please find page 47 of the 2006 Dollar Tree annual report below. You can navigate through the pages in the report by either clicking on the pages listed below, or by using the keyword search tool below to find specific information within the annual report.-
 1
1 -
2
-
3
-
4
-
5
-
6
-
7
-
8
-
9
-
10
-
11
-
12
-
13
-
14
-
15
-
16
-
17
-
18
-
19
-
20
-
21
-
22
-
23
-
24
-
25
-
26
-
27
-
28
-
29
-
30
-
31
-
32
-
33
-
34
-
35
-
36
-
 37
37 -
 38
38 -
 39
39 -
 40
40 -
 41
41 -
 42
42 -
 43
43 -
 44
44 -
 45
45 -
 46
46 -
 47
47 -
 48
48 -
 49
49 -
 50
50 -
 51
51 -
 52
52
 |
 |

DOLLAR TREE STORES, INC. • 2006 ANNUAL REPORT 45
of options issued to a director will equal the deferred
fee amount divided by 33% of the price of a share of
the Company’s common stock. The exercise price will
equal the fair market value of the Company’s common
stock at the date the option is issued. The options are
fully vested when issued and have a term of 10 years.
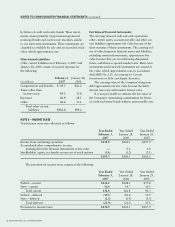
Stock Options
In 2006, the Company granted a total of 342,216
stock options from the EIP, EOEP and the NEDP. For
these options, the fair value of each option grant was
estimated on the date of grant using the Black-Scholes
option-pricing model and the fair value of these options
of $3.4 million, net of expected forfeitures, is being
recognized over the three-year vesting period of these
options, or a shorter period based on the retirement
eligibility of the grantee. All options granted to direc-
tors vest immediately and are expensed on the grant
date. During 2006, the Company recognized $1.3
million of expense related to the 2006 option grants.
As of February 3, 2007, there was approximately
$2.1 million of total unrecognized compensation
expense related to these stock options which is
expected to be recognized over a weighted average
period of 26 months. The expected term of the
awards granted was calculated using the “simplified
method” in accordance with Staff Accounting Bulletin
No. 107. Expected volatility is derived from an analy-
sis of the historical and implied volatility of the
Company’s publicly traded stock. The risk free rate is
based on the U.S. Treasury rates on the grant date
with maturity dates approximating the expected life
of the option on the grant date. For proforma disclo-
sures required under FAS 123, the fair value of option
awards in 2005 and 2004 was also calculated using
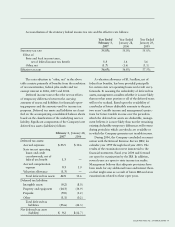
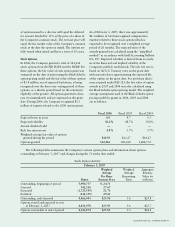
the Black-Scholes option-pricing model. The weighted
average assumptions used in the Black-Scholes option
pricing model for grants in 2006, 2005 and 2004
are as follows:
Fiscal 2006 Fiscal 2005 Fiscal 2004
Expected term in years 6.0 4.7 5.3
Expected volatility 30.2% 48.7% 59.8%
Annual dividend yield ———
Risk free interest rate 4.8% 3.7% 3.7%
Weighted average fair value of options
granted during the period $10.93 $11.27 $14.27
Options granted 342,216 320,220 1,682,572
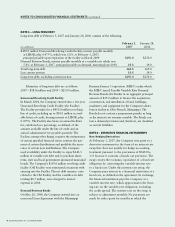
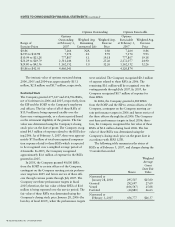
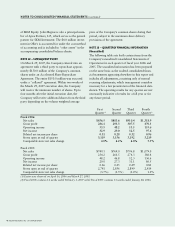
The following tables summarize the Company’s various option plans and information about options
outstanding at February 3, 2007 and changes during the 53 weeks then ended.
Stock Option Activity
February 3, 2007
Weighted Weighted Aggregate
Average Average Intrinsic
Per Share Remaining Value (in
Shares Exercise Price Term millions)
Outstanding, beginning of period 5,990,757 $ 24.71
Granted 342,216 27.67
Exercised (1,725,593) 21.70
Forfeited (141,339) 29.23
Outstanding, end of period 4,466,041 $25.96 5.6 $25.8
Options vested and expected to vest
at February 3, 2007 4,431,978 $25.95 5.6 $25.7
Options exercisable at end of period 4,126,874 $25.83 5.3 $24.4