Dollar Tree 2006 Annual Report Download - page 18
Download and view the complete annual report
Please find page 18 of the 2006 Dollar Tree annual report below. You can navigate through the pages in the report by either clicking on the pages listed below, or by using the keyword search tool below to find specific information within the annual report.-
 1
1 -
2
-
3
-
4
-
5
-
6
-
7
-
 8
8 -
 9
9 -
 10
10 -
 11
11 -
 12
12 -
 13
13 -
 14
14 -
 15
15 -
 16
16 -
 17
17 -
 18
18 -
 19
19 -
 20
20 -
 21
21 -
 22
22 -
 23
23 -
 24
24 -
 25
25 -
 26
26 -
 27
27 -
 28
28 -
29
-
30
-
31
-
32
-
33
-
34
-
35
-
36
-
37
-
38
-
39
-
40
-
41
-
42
-
43
-
44
-
45
-
46
-
47
-
48
-
49
-
50
-
51
-
52
 |
 |

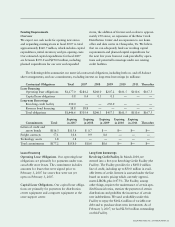
$70 million in sales. Fiscal 2005 ended on January 28,
2006 and included 52 weeks.
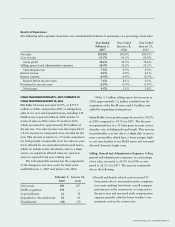
In fiscal 2006, comparable store net sales
increased by 4.6%. This increase was based on 53
weeks for both periods. The comparable store net
sales increase was the result of increases of 1.9% in
the number of transactions and 2.7% in transaction
size, compared to fiscal 2005. We believe comparable
store net sales were positively affected by the initia-
tives we began putting in place in 2005, including
expansion of forms of payment accepted by our
stores and the roll-out of freezers and coolers to more
of our stores. During 2006, we completed the roll-out
of debit card acceptance to all of our stores, which
has enabled us to accept Electronic Benefit Transfer
cards and we now accept food stamps in approxi-
mately 600 qualified stores. We believe the expansion
of forms of payment accepted by our stores has helped
increase the average transaction size in our stores.
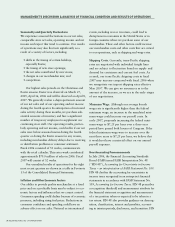
In 2006, we continued to experience a slight shift
in the mix of merchandise sold to more consumables,
which we believe increases the traffic in our stores but
have lower margin. The planned shift in mix to more
consumables is the result of the roll-out of freezers
and coolers to more stores in 2005 and 2006. At
February 3, 2007, we had freezers and coolers in
approximately 700 stores, compared to approximately
250 stores at January 28, 2006. We plan to add freez-
ers and coolers to approximately 250 more stores in
2007, which we believe will continue to pressure
margins, as a percentage of sales, in 2007. However,
we believe that this will enable us to increase sales
and earnings in the future by increasing the number
of shopping trips made by our customers.
Our point-of-sale technology is now in all of our
stores, and this technology provides us with valuable
sales and inventory information to assist our buyers
and improve our merchandise allocation to our
stores. We believe that this has enabled us to better
control our inventory, resulting in more efficient
distribution and store operations and increased
inventory turnover. Using the data captured at the
MANAGEMENT’S DISCUSSION & ANALYSIS OF FINANCIAL CONDITION AND RESULTS OF OPERATIONS
point-of-sale has enabled us to better plan our inven-
tory purchases and helped us reduce our inventory
investment per store by approximately 5.0% at
February 3, 2007 compared to January 28, 2006. In
addition, inventory turnover has increased 70 basis
points in 2006 as compared to 2005.
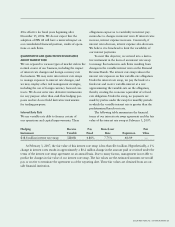
We must continue to control our merchandise
costs, inventory levels and our general and adminis-
trative expenses. Increases in these expenses could
negatively impact our operating results.
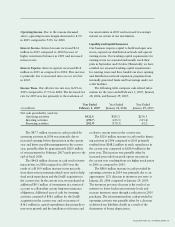
Our plans for fiscal 2007 anticipate comparable
store net sales increases of approximately 1% to 3%
yielding net sales in the $4.22 billion to $4.33 billion
range and diluted earnings per share of $1.96 to
$2.10. This guidance for 2007 is predicated on selling
square footage growth of approximately 10%.
On March 25, 2006, we completed our acquisi-
tion of 138 Deal$ stores. These stores are located
primarily in the Midwest part of the United States
and we have existing logistics capacity to service these
stores. This acquisition also included a few “combo”
stores that offer an expanded assortment of merchan-
dise including items that sell for more than $1.
Substantially all Deal$ stores acquired continue to
operate under the Deal$ banner while providing us an
opportunity to leverage our Dollar Tree infrastructure
in the testing of new merchandise concepts, including
higher price points, without disrupting the single-price
point model in our Dollar Tree stores. At February 3,
2007, 121 of these stores were selling items priced at
over $1.00.
We paid approximately $32.0 million for store-
related and other assets and $22.1 million for inven-
tory. The results of Deal$ store operations are included
in our financial statements since the acquisition date
and did not have a significant impact on our operating
results through February 3, 2007. This acquisition is
immaterial to our operations as a whole and therefore
no proforma disclosure of financial information has
been presented.
16 DOLLAR TREE STORES, INC. • 2006 ANNUAL REPORT