Dollar Tree 2006 Annual Report Download - page 39
Download and view the complete annual report
Please find page 39 of the 2006 Dollar Tree annual report below. You can navigate through the pages in the report by either clicking on the pages listed below, or by using the keyword search tool below to find specific information within the annual report.-
 1
1 -
2
-
3
-
4
-
5
-
6
-
7
-
8
-
9
-
10
-
11
-
12
-
13
-
14
-
15
-
16
-
17
-
18
-
19
-
20
-
21
-
22
-
23
-
24
-
25
-
26
-
27
-
28
-
 29
29 -
 30
30 -
 31
31 -
 32
32 -
 33
33 -
 34
34 -
 35
35 -
 36
36 -
 37
37 -
 38
38 -
 39
39 -
 40
40 -
 41
41 -
 42
42 -
 43
43 -
 44
44 -
 45
45 -
 46
46 -
 47
47 -
 48
48 -
 49
49 -
50
-
51
-
52
 |
 |

DOLLAR TREE STORES, INC. • 2006 ANNUAL REPORT 37
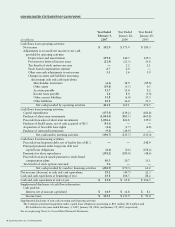
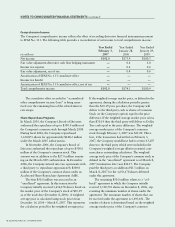
A reconciliation of the statutory federal income tax rate and the effective rate follows:
Year Ended Year Ended Year Ended
February 3, January 28, January 29,
2007 2006 2005
Statutory tax rate 35.0% 35.0% 35.0%
Effect of:
State and local income taxes,
net of federal income tax benefit 3.3 3.4 3.6
Other, net (1.7) (1.6) (1.1)
Effective tax rate 36.6% 36.8% 37.5%
The rate reduction in “other, net” in the above
table consists primarily of benefits from the resolution
of tax uncertainties, federal jobs credits and tax
exempt interest in 2006, 2005 and 2004.
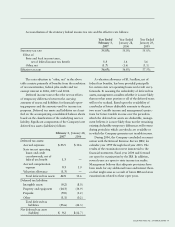
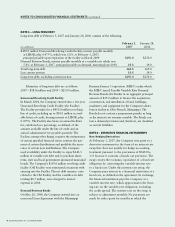
Deferred income taxes reflect the net tax effects
of temporary differences between the carrying
amounts of assets and liabilities for financial report-
ing purposes and the amounts used for income tax
purposes. Deferred tax assets and liabilities are classi-
fied on the accompanying consolidated balance sheets
based on the classification of the underlying asset or
liability. Significant components of the Company’s net
deferred tax assets (liabilities) follows:
February 3, January 28,
2007 2006
Deferred tax assets:
Accrued expenses $ 33.5 $ 30.6
State tax net operating
losses and credit
carryforwards, net of
federal tax benefit 1.3 —
Accrued compensation
expense 9.3 1.0
Valuation allowance (1.3) —
Total deferred tax assets 42.8 31.6
Deferred tax liabilities:
Intangible assets (9.2) (8.0)
Property and equipment (14.3) (34.9)
Prepaids (9.0) (1.2)
Other (1.1) (0.2)
Total deferred tax
liabilities (33.6) (44.3)
Net deferred tax asset
(liability) $ 9.2 $(12.7)
A valuation allowance of $1.3 million, net of
federal tax benefits, has been provided principally
for certain state net operating losses and credit carry-
forwards. In assessing the realizability of deferred tax
assets, management considers whether it is more likely
than not that some portion or all of the deferred taxes
will not be realized. Based upon the availability of
carrybacks of future deductible amounts to the past
two years’ taxable income and management’s projec-
tions for future taxable income over the periods in
which the deferred tax assets are deductible, manage-
ment believes it is more likely than not the remaining
existing deductible temporary differences will reverse
during periods in which carrybacks are available or
in which the Company generates net taxable income.
During 2006, the Company concluded an exami-
nation with the Internal Revenue Service (IRS) for
calendar year 1999 through fiscal year 2003. The
results of the examination were immaterial to the
financial statements. Fiscal year 2004 and forward
are open for examination by the IRS. In addition,
several years are open to state income tax audits.
Management believes that adequate provisions have
been made for any additional taxes and interest there-
on that might arise as a result of future IRS and state
examinations related to these open years.