Dollar Tree 2006 Annual Report Download - page 20
Download and view the complete annual report
Please find page 20 of the 2006 Dollar Tree annual report below. You can navigate through the pages in the report by either clicking on the pages listed below, or by using the keyword search tool below to find specific information within the annual report.-
 1
1 -
2
-
3
-
4
-
5
-
6
-
7
-
8
-
9
-
 10
10 -
 11
11 -
 12
12 -
 13
13 -
 14
14 -
 15
15 -
 16
16 -
 17
17 -
 18
18 -
 19
19 -
 20
20 -
 21
21 -
 22
22 -
 23
23 -
 24
24 -
 25
25 -
 26
26 -
 27
27 -
 28
28 -
 29
29 -
 30
30 -
31
-
32
-
33
-
34
-
35
-
36
-
37
-
38
-
39
-
40
-
41
-
42
-
43
-
44
-
45
-
46
-
47
-
48
-
49
-
50
-
51
-
52
 |
 |

• Operating and corporate expenses decreased 10
basis points primarily as the result of payments
received for early lease terminations in the
current year.
Operating Income. Due to the reasons discussed
above, operating income margin decreased to 7.8%
in 2006 compared to 8.4% in 2005.
Income Taxes. Our effective tax rate was 36.6% in
2006 compared to 36.8% in 2005. The decreased
tax rate for 2006 was due primarily to increased
tax-exempt interest on certain of our investments
in the current year.
FISCAL YEAR ENDED JANUARY 28, 2006 COMPARED TO
FISCAL YEAR ENDED JANUARY 29, 2005
Net Sales. Net sales increased 8.6% in 2005 com-
pared to 2004. We attribute this $267.9 million
increase in net sales primarily to new stores in 2005
and 2004 (which are not included in our comparable
store net sales calculation) partially offset by a slight
decrease in comparable store net sales of 0.8% in
2005. Our comparable store net sales are positively
affected by our expanded and relocated stores, which
we include in the calculation, and, to a lesser extent,
are negatively affected when we open new stores or
expand stores near existing stores.
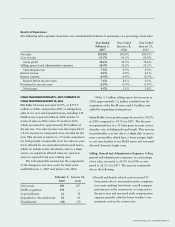
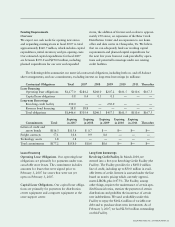
The following table summarizes the components
of the changes in our store count for fiscal years
ended January 28, 2006 and January 29, 2005.
January 28, January 29,
2006 2005
New stores 197 209
Acquired leases 35 42
Expanded or relocated stores 93 129
Closed stores (53) (29)
Of the 2.6 million selling square foot increase in
2005, approximately 0.5 million in selling square feet
was added by expanding existing stores.
MANAGEMENT’S DISCUSSION & ANALYSIS OF FINANCIAL CONDITION AND RESULTS OF OPERATIONS
Gross Profit. Gross profit margin decreased to 34.5%
in 2005 compared to 35.6% in 2004. The decrease is
primarily due to the following:
• Merchandise cost, including inbound freight,
increased approximately 55 basis points, due to
a slight shift in mix to more consumables, which
have a lower margin and increased inbound
freight costs due to higher fuel costs.
• Occupancy costs increased approximately 45
basis points due primarily to deleveraging associ-
ated with the negative comparable store net sales
for the year.
Selling, General and Administrative Expenses. Selling,
general and administrative expenses, as a percentage
of net sales, were 26.2% for 2005 and 2004.
However, several components had increases or
decreases as noted below:
• Operating and corporate expenses decreased
approximately 25 basis points primarily due to
decreased store supplies expense as a result of
better pricing, decreased professional fees and
the receipt of insurance proceeds resulting from
a fire at one of our locations, partially offset by
increased interchange fees resulting from the
rollout of debit card acceptance in 2005.
• Payroll related costs decreased approximately
10 basis points due to a reduction in incentive
compensation accruals that are based on lower
than budgeted 2005 earnings and lower workers’
compensation and health care claims in 2005.
• These decreases were partially offset by an
approximate 25 basis point increase in store oper-
ating costs primarily due to higher utility costs
due to higher rates and consumption in 2005.
• Depreciation expense for stores also increased
10 basis points primarily due to the deleveraging
associated with negative comparable store net
sales for 2005.
18 DOLLAR TREE STORES, INC. • 2006 ANNUAL REPORT