Dollar Tree 2006 Annual Report Download - page 21
Download and view the complete annual report
Please find page 21 of the 2006 Dollar Tree annual report below. You can navigate through the pages in the report by either clicking on the pages listed below, or by using the keyword search tool below to find specific information within the annual report.-
 1
1 -
2
-
3
-
4
-
5
-
6
-
7
-
8
-
9
-
10
-
 11
11 -
 12
12 -
 13
13 -
 14
14 -
 15
15 -
 16
16 -
 17
17 -
 18
18 -
 19
19 -
 20
20 -
 21
21 -
 22
22 -
 23
23 -
 24
24 -
 25
25 -
 26
26 -
 27
27 -
 28
28 -
 29
29 -
 30
30 -
 31
31 -
32
-
33
-
34
-
35
-
36
-
37
-
38
-
39
-
40
-
41
-
42
-
43
-
44
-
45
-
46
-
47
-
48
-
49
-
50
-
51
-
52
 |
 |

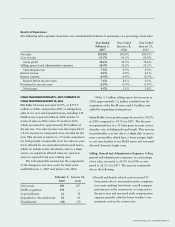
Operating Income. Due to the reasons discussed
above, operating income margin decreased to 8.3%
in 2005 compared to 9.4% for 2004.
Interest Income. Interest income increased $2.2
million in 2005 compared to 2004 because of
higher investment balances in 2005 and increased
interest rates.
Interest Expense. Interest expense increased $4.8
million in 2005 as compared to 2004. This increase
is primarily due to increased rates on our revolver
in 2005.
Income Taxes. Our effective tax rate was 36.8% in
2005 compared to 37.5% in 2004. The decreased tax
rate for 2005 was due primarily to the resolution of
DOLLAR TREE STORES, INC. • 2006 ANNUAL REPORT 19
coolers to certain stores in the current year.
The $32.6 million increase in cash used in financ-
ing activities in 2006 compared to 2005 primarily
resulted from $248.2 million in stock repurchases in
the current year compared to $180.4 million in the
prior year. This increase was partially offset by
increased proceeds from stock option exercises in
the current year resulting from our higher stock prices
in 2006 as compared to 2005.
The $88.6 million increase in cash provided by
operating activities in 2005 was primarily due to an
approximate 12% decrease in inventory per store at
January 28, 2006 compared to January 29, 2005.
The inventory per store decrease is the result of an
initiative to lower backroom inventory levels and
increase inventory turns through a reduction in 2005
purchases. The aforementioned net cash provided by
operating activities was partially offset by a decrease
in deferred tax liabilities chiefly as a result of the
elimination of bonus depreciation.
The $47.7 million increase in cash provided by
operating activities in 2006 was primarily due to
increased earnings before depreciation in the current
year and better payables management in the current
year, partially offset by approximately $20.0 million
of rent payments for February 2007 made prior to the
end of fiscal 2006.
The $44.8 million decrease in cash used in invest-
ing activities in 2006 compared to 2005 was the
result of a $114.9 million increase in net proceeds
from short-term investments which were used to help
fund stock repurchases and the Deal$ acquisition in
the current year. In the current year, we purchased an
additional $9.3 million of investments in a restricted
account to collateralize certain long-term insurance
obligations. Additional uses of cash for investing
activities consisted of $54.1 million for the Deal$
acquisition in the current year and an increase of
$36.1 million in capital expenditures due primarily to
new store growth and the installation of freezers and
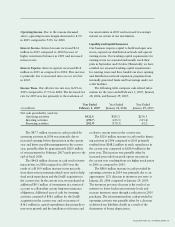
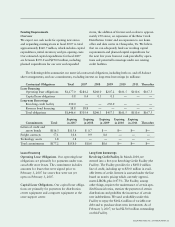
Year Ended Year Ended Year Ended
(in millions) February 3, 2007 January 28, 2006 January 29, 2005
Net cash provided by (used in):
Operating activities $412.8 $365.1 $276.5
Investing activities (190.7) (235.5) (315.4)
Financing activities (202.9) (170.3) 61.2
tax uncertainties in 2005 and increased tax-exempt
interest on certain of our investments.
Liquidity and Capital Resources
Our business requires capital to build and open new
stores, expand our distribution network and operate
existing stores. Our working capital requirements for
existing stores are seasonal and usually reach their
peak in September and October. Historically, we have
satisfied our seasonal working capital requirements
for existing stores and have funded our store opening
and distribution network expansion programs from
internally generated funds and borrowings under our
credit facilities.
The following table compares cash-related infor-
mation for the years ended February 3, 2007, January
28, 2006, and January 29, 2005: