Dollar Tree 2006 Annual Report Download - page 48
Download and view the complete annual report
Please find page 48 of the 2006 Dollar Tree annual report below. You can navigate through the pages in the report by either clicking on the pages listed below, or by using the keyword search tool below to find specific information within the annual report.-
 1
1 -
2
-
3
-
4
-
5
-
6
-
7
-
8
-
9
-
10
-
11
-
12
-
13
-
14
-
15
-
16
-
17
-
18
-
19
-
20
-
21
-
22
-
23
-
24
-
25
-
26
-
27
-
28
-
29
-
30
-
31
-
32
-
33
-
34
-
35
-
36
-
37
-
 38
38 -
 39
39 -
 40
40 -
 41
41 -
 42
42 -
 43
43 -
 44
44 -
 45
45 -
 46
46 -
 47
47 -
 48
48 -
 49
49 -
 50
50 -
 51
51 -
 52
52
 |
 |

NOTES TO CONSOLIDATED FINANCIAL STATEMENTS (continued)
46 DOLLAR TREE STORES, INC. • 2006 ANNUAL REPORT
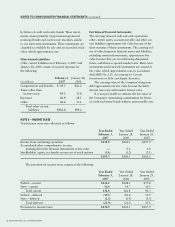
The intrinsic value of options exercised during
2006, 2005 and 2004 was approximately $13.1
million, $2.8 million and $5.7 million, respectively.
Restricted Stock
The Company granted 277,347 and 252,936 RSUs,
net of forfeitures in 2006 and 2005, respectively, from
the EIP and the EOEP to the Company’s employees
and officers. The fair value of all of these RSUs of
$13.9 million is being expensed ratably over the
three-year vesting periods, or a shorter period based
on the retirement eligibility of the grantee. The fair
value was determined using the Company’s closing
stock price on the date of grant. The Company recog-
nized $4.5 million of expense related to the RSUs dur-
ing 2006. As of February 3, 2007, there was approxi-
mately $7.8 million of total unrecognized compensa-
tion expense related to these RSUs which is expected
to be recognized over a weighted average period of
24 months. In 2005, the Company recognized
approximately $1.6 million of expense for the RSUs
granted in 2005.
In 2005, the Company granted 40,000 RSUs
from the EOEP to certain officers of the Company,
contingent on the Company meeting certain perform-
ance targets in 2005 and future service of these offi-
cers through various points through July 2007. The
Company met these performance targets in fiscal
2005; therefore, the fair value of these RSUs of $1.0
million is being expensed over the service period. The
fair value of these RSUs was determined using the
Company’s closing stock price January 28, 2006 (the
last day of fiscal 2005), when the performance targets
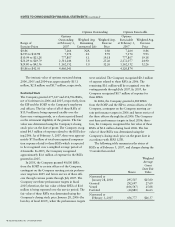
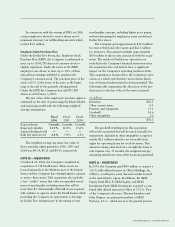
Options Outstanding Options Exercisable
Options Options
Outstanding Weighted Avg. Weighted Avg. Exercisable Weighted Avg.
Range of at February 3, Remaining Exercise at February 3, Exercise
Exercise Prices 2007 Contractual Life Price 2007 Price
$0.86 7,264 N/A 0.86 7,264 0.86
$2.95 to $10.98 7,174 0.1 9.93 7,174 9.93
$10.99 to $21.28 777,807 5.1 19.18 777,807 19.18
$21.29 to $29.79 2,511,244 5.8 25.26 2,172,077 24.90
$29.80 to $42.56 1,162,552 5.0 32.26 1,162,552 32.26
$0.86 to $42.56 4,466,041 4,126,874
were satisfied. The Company recognized $0.3 million
of expense related to these RSUs in 2006. The
remaining $0.1 million will be recognized over the
vesting periods through July 2007. In 2005, the
Company recognized $0.7 million of expense for
these RSUs.
In 2006, the Company granted 6,000 RSUs
from the EOEP and the EIP to certain officers of the
Company, contingent on the Company meeting cer-
tain performance targets in 2006 and future service of
the these officers through fiscal 2006. The Company
met these performance targets in fiscal 2006; there-
fore, the Company recognized the fair value of these
RSUs of $0.2 million during fiscal 2006. The fair
value of these RSUs was determined using the
Company’s closing stock price on the grant date in
accordance with SFAS 123R.
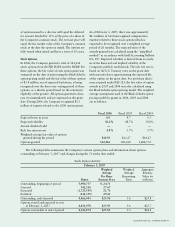
The following table summarizes the status of
RSUs as of February 3, 2007, and changes during the
53 weeks then ended:
Weighted
Average
Grant
Date Fair
Shares Value
Nonvested at
January 28, 2006 295,507 $25.00
Granted 292,697 27.69
Vested (106,547) 25.08
Forfeited (24,880) 26.63
Nonvested at
February 3, 2007 456,777 $26.57