Cisco 2014 Annual Report Download - page 75
Download and view the complete annual report
Please find page 75 of the 2014 Cisco annual report below. You can navigate through the pages in the report by either clicking on the pages listed below, or by using the keyword search tool below to find specific information within the annual report.-
 1
1 -
2
-
3
-
4
-
5
-
6
-
7
-
8
-
9
-
10
-
11
-
12
-
13
-
14
-
15
-
16
-
17
-
18
-
19
-
20
-
21
-
22
-
23
-
24
-
25
-
26
-
27
-
28
-
29
-
30
-
31
-
32
-
33
-
34
-
35
-
36
-
37
-
38
-
39
-
40
-
41
-
42
-
43
-
44
-
45
-
46
-
47
-
48
-
49
-
50
-
51
-
52
-
53
-
54
-
55
-
56
-
57
-
58
-
59
-
60
-
61
-
62
-
63
-
64
-
 65
65 -
 66
66 -
 67
67 -
 68
68 -
 69
69 -
 70
70 -
 71
71 -
 72
72 -
 73
73 -
 74
74 -
 75
75 -
 76
76 -
 77
77 -
 78
78 -
 79
79 -
 80
80 -
 81
81 -
 82
82 -
 83
83 -
 84
84 -
 85
85 -
86
-
87
-
88
-
89
-
90
-
91
-
92
-
93
-
94
-
95
-
96
-
97
-
98
-
99
-
100
-
101
-
102
-
103
-
104
-
105
-
106
-
107
-
108
-
109
-
110
-
111
-
112
-
113
-
114
-
115
-
116
-
117
-
118
-
119
-
120
-
121
-
122
-
123
-
124
-
125
-
126
-
127
-
128
-
129
-
130
-
131
-
132
-
133
-
134
-
135
-
136
-
137
-
138
-
139
-
140
 |
 |

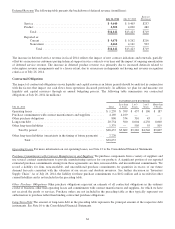
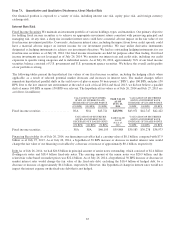
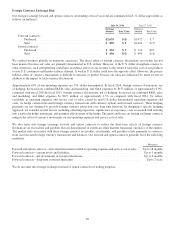
Item 7A. Quantitative and Qualitative Disclosures About Market Risk
Our financial position is exposed to a variety of risks, including interest rate risk, equity price risk, and foreign currency
exchange risk.
Interest Rate Risk
Fixed Income Securities We maintain an investment portfolio of various holdings, types, and maturities. Our primary objective
for holding fixed income securities is to achieve an appropriate investment return consistent with preserving principal and
managing risk. At any time, a sharp rise in market interest rates could have a material adverse impact on the fair value of our
fixed income investment portfolio. Conversely, declines in interest rates, including the impact from lower credit spreads, could
have a material adverse impact on interest income for our investment portfolio. We may utilize derivative instruments
designated as hedging instruments to achieve our investment objectives. We had no outstanding hedging instruments for our
fixed income securities as of July 26, 2014. Our fixed income investments are held for purposes other than trading. Our fixed
income investments are not leveraged as of July 26, 2014. We monitor our interest rate and credit risks, including our credit
exposures to specific rating categories and to individual issuers. As of July 26, 2014, approximately 76% of our fixed income
securities balance consisted of U.S. government and U.S. government agency securities. We believe the overall credit quality
of our portfolio is strong.
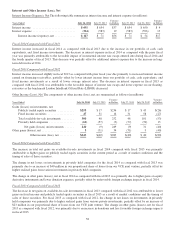
The following tables present the hypothetical fair values of our fixed income securities, including the hedging effects when
applicable, as a result of selected potential market decreases and increases in interest rates. The market changes reflect
immediate hypothetical parallel shifts in the yield curve of plus or minus 50 basis points (“BPS”), plus 100 BPS, and plus 150
BPS. Due to the low interest rate environment at the end of each of fiscal 2014 and fiscal 2013, we did not believe a parallel
shift of minus 100 BPS or minus 150 BPS was relevant. The hypothetical fair values as of July 26, 2014 and July 27, 2013 are
as follows (in millions):
VALUATION OF SECURITIES
GIVEN AN INTEREST RATE
DECREASE OF X BASIS POINTS
FAIR VALUE
AS OF
JULY 26,
2014
VALUATION OF SECURITIES
GIVEN AN INTEREST RATE
INCREASE OF X BASIS POINTS
(150 BPS) (100 BPS) (50 BPS) 50 BPS 100 BPS 150 BPS
Fixed income securities ................... N/A N/A $43,721 $43,396 $43,071 $42,747 $42,422
VALUATION OF SECURITIES
GIVEN AN INTEREST RATE
DECREASE OF X BASIS POINTS
FAIR VALUE
AS OF
JULY 27,
2013
VALUATION OF SECURITIES
GIVEN AN INTEREST RATE
INCREASE OF X BASIS POINTS
(150 BPS) (100 BPS) (50 BPS) 50 BPS 100 BPS 150 BPS
Fixed income securities .................... N/A N/A $40,193 $39,888 $39,583 $39,278 $38,973
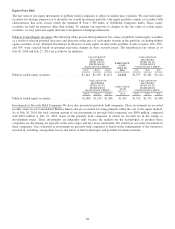
Financing Receivables As of July 26, 2014, our financing receivables had a carrying value of $8.1 billion, compared with $7.9
billion as of July 27, 2013. As of July 26, 2014, a hypothetical 50 BPS increase or decrease in market interest rates would
change the fair value of our financing receivables by a decrease or increase of approximately $0.1 billion, respectively.
Debt As of July 26, 2014, we had $20.8 billion in principal amount of senior notes outstanding, which consisted of $2.4 billion
floating-rate notes and $18.4 billion fixed-rate notes. The carrying amount of the senior notes was $20.9 billion, and the
related fair value based on market prices was $22.4 billion. As of July 26, 2014, a hypothetical 50 BPS increase or decrease in
market interest rates would change the fair value of the fixed-rate debt, excluding the $10.4 billion of hedged debt, by a
decrease or increase of approximately $0.4 billion, respectively. However, this hypothetical change in interest rates would not
impact the interest expense on the fixed-rate debt that is not hedged.
67