Cisco 2014 Annual Report Download - page 107
Download and view the complete annual report
Please find page 107 of the 2014 Cisco annual report below. You can navigate through the pages in the report by either clicking on the pages listed below, or by using the keyword search tool below to find specific information within the annual report.-
 1
1 -
2
-
3
-
4
-
5
-
6
-
7
-
8
-
9
-
10
-
11
-
12
-
13
-
14
-
15
-
16
-
17
-
18
-
19
-
20
-
21
-
22
-
23
-
24
-
25
-
26
-
27
-
28
-
29
-
30
-
31
-
32
-
33
-
34
-
35
-
36
-
37
-
38
-
39
-
40
-
41
-
42
-
43
-
44
-
45
-
46
-
47
-
48
-
49
-
50
-
51
-
52
-
53
-
54
-
55
-
56
-
57
-
58
-
59
-
60
-
61
-
62
-
63
-
64
-
65
-
66
-
67
-
68
-
69
-
70
-
71
-
72
-
73
-
74
-
75
-
76
-
77
-
78
-
79
-
80
-
81
-
82
-
83
-
84
-
85
-
86
-
87
-
88
-
89
-
90
-
91
-
92
-
93
-
94
-
95
-
96
-
 97
97 -
 98
98 -
 99
99 -
 100
100 -
 101
101 -
 102
102 -
 103
103 -
 104
104 -
 105
105 -
 106
106 -
 107
107 -
 108
108 -
 109
109 -
 110
110 -
 111
111 -
 112
112 -
 113
113 -
 114
114 -
 115
115 -
 116
116 -
 117
117 -
118
-
119
-
120
-
121
-
122
-
123
-
124
-
125
-
126
-
127
-
128
-
129
-
130
-
131
-
132
-
133
-
134
-
135
-
136
-
137
-
138
-
139
-
140
 |
 |

make its assessments and determinations as to the ultimate valuation of its investment portfolio and has not made, during the
periods presented, any material adjustments to such inputs. The Company is ultimately responsible for the financial statements
and underlying estimates. The Company’s derivative instruments are primarily classified as Level 2, as they are not actively
traded and are valued using pricing models that use observable market inputs. The Company did not have any transfers
between Level 1 and Level 2 fair value measurements during the periods presented.
Level 3 assets include certain derivative instruments, the values of which are determined based on discounted cash flow
models using inputs that the Company could not corroborate with market data.
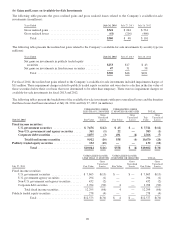
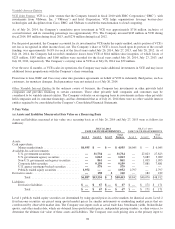
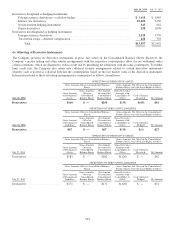
(b) Assets Measured at Fair Value on a Nonrecurring Basis
The following table presents the Company’s financial instruments and nonfinancial assets that were measured at fair value on
a nonrecurring basis during the indicated periods and the related recognized gains and losses for the periods (in millions):
July 26, 2014 July 27, 2013 July 28, 2012
Net Carrying
Value as of
Year End
Total Gains
(Losses)
for the
Year Ended
Net Carrying
Value as of
Year End
Total Gains
(Losses)
for the
Year Ended
Net Carrying
Value as of
Year End
Total Gains
(Losses)
for the
Year Ended
Assets held for sale ................................ $— $— $ 1 $ (1) $ 63 $(413)
Investments in privately held companies (impaired) ...... $ 28 (21) $ 63 (31) $ 47 (23)
Purchased intangible assets .......................... $— — $ — — $ — (12)
Gains (losses) on assets no longer held at end of fiscal year . .
(2) 75 14
Total gains (losses) for nonrecurring measurements ...... $ (23) $ 43 $(434)
The assets in the preceding table were measured at fair value due to events or circumstances the Company identified as having
significant impact on their fair value during the respective periods. To arrive at the valuation of these assets, the Company considers
any significant changes in the financial metrics and economic variables and also uses third-party valuation reports to assist in the
valuation as necessary. These assets were classified as Level 3 assets because the Company used unobservable inputs to value them.
The assets held for sale represent land and buildings that met the criteria to be classified as held for sale. The fair value of
assets held for sale was measured with the assistance of third-party valuation models, which used discounted cash flow
techniques as part of their analysis. The fair value measurement was categorized as Level 3 as significant unobservable inputs
were used in the valuation report. The impairment charges as a result of the valuations, which represented the difference
between the fair value less cost to sell and the carrying amount of the assets held for sale, were included in G&A expenses.
The fair value measurement of the impaired investments was classified as Level 3 because significant unobservable inputs were
used in the valuation due to the absence of quoted market prices and inherent lack of liquidity. Significant unobservable inputs,
which included financial metrics of comparable private and public companies, financial condition and near-term prospects of the
investees, recent financing activities of the investees, and the investees’ capital structure as well as other economic variables,
reflected the assumptions market participants would use in pricing these assets. The impairment charges, representing the
difference between the net book value and the fair value as a result of the evaluation, were recorded to other income (loss), net.
The fair value of purchased intangible assets measured at fair value on a nonrecurring basis was categorized as Level 3 due to
the use of significant unobservable inputs in the valuation. Significant unobservable inputs that were used included expected
revenues and net income related to the assets and the expected life of the assets. The difference between the estimated fair
value and the carrying value of the assets was recorded as an impairment charge. There was no impairment charge related to
purchased intangible assets during the fiscal years ended July 26, 2014 and July 27, 2013. For the fiscal year ended July 28,
2012, such impairment charges were recorded in cost of sales and operating expenses as appropriate. See Note 4.
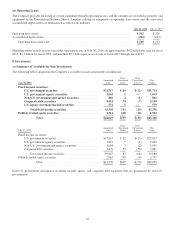
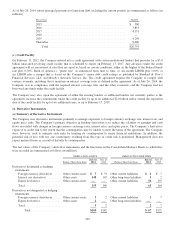
(c) Other Fair Value Disclosures
The carrying value of the Company’s investments in privately held companies that were accounted for under the cost method
was $269 million and $242 million as of July 26, 2014 and July 27, 2013, respectively. It was not practicable to estimate the
fair value of this portfolio.
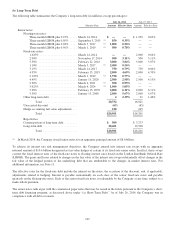
The fair value of the Company’s short-term loan receivables and financed service contracts approximates their carrying value
due to their short duration. The aggregate carrying value of the Company’s long-term loan receivables and financed service
contracts and other as of July 26, 2014 and July 27, 2013 was $2.1 billion. The estimated fair value of the Company’s long-
99