Cisco 2014 Annual Report Download - page 69
Download and view the complete annual report
Please find page 69 of the 2014 Cisco annual report below. You can navigate through the pages in the report by either clicking on the pages listed below, or by using the keyword search tool below to find specific information within the annual report.-
 1
1 -
2
-
3
-
4
-
5
-
6
-
7
-
8
-
9
-
10
-
11
-
12
-
13
-
14
-
15
-
16
-
17
-
18
-
19
-
20
-
21
-
22
-
23
-
24
-
25
-
26
-
27
-
28
-
29
-
30
-
31
-
32
-
33
-
34
-
35
-
36
-
37
-
38
-
39
-
40
-
41
-
42
-
43
-
44
-
45
-
46
-
47
-
48
-
49
-
50
-
51
-
52
-
53
-
54
-
55
-
56
-
57
-
58
-
 59
59 -
 60
60 -
 61
61 -
 62
62 -
 63
63 -
 64
64 -
 65
65 -
 66
66 -
 67
67 -
 68
68 -
 69
69 -
 70
70 -
 71
71 -
 72
72 -
 73
73 -
 74
74 -
 75
75 -
 76
76 -
 77
77 -
 78
78 -
 79
79 -
80
-
81
-
82
-
83
-
84
-
85
-
86
-
87
-
88
-
89
-
90
-
91
-
92
-
93
-
94
-
95
-
96
-
97
-
98
-
99
-
100
-
101
-
102
-
103
-
104
-
105
-
106
-
107
-
108
-
109
-
110
-
111
-
112
-
113
-
114
-
115
-
116
-
117
-
118
-
119
-
120
-
121
-
122
-
123
-
124
-
125
-
126
-
127
-
128
-
129
-
130
-
131
-
132
-
133
-
134
-
135
-
136
-
137
-
138
-
139
-
140
 |
 |

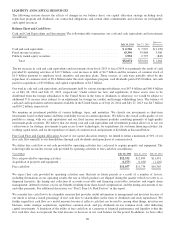
required uses of cash, including repaying the principal of our outstanding indebtedness. Free cash flow is not a measure
calculated in accordance with U.S. generally accepted accounting principles and should not be regarded in isolation or as an
alternative for net income provided by operating activities or any other measure calculated in accordance with such principles,
and other companies may calculate free cash flow in a different manner than we do.
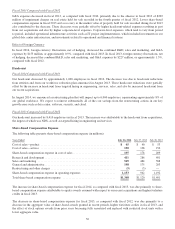
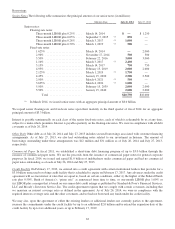
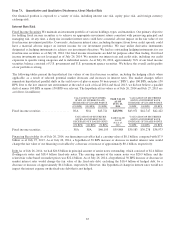
The following table summarizes the dividends paid and stock repurchases (in millions, except per-share amounts):
DIVIDENDS STOCK REPURCHASE PROGRAM TOTAL
Years Ended Per Share Amount Shares
Weighted-Average
Price per Share Amount Amount
July 26, 2014 ...................................... $0.72 $3,758 420 $22.71 $9,539 $13,297
July 27, 2013 ....................................... $0.62 $3,310 128 $21.63 $2,773 $ 6,083
July 28, 2012 ....................................... $0.28 $1,501 262 $16.64 $4,360 $ 5,861
On August 26, 2014, our Board of Directors declared a quarterly dividend of $0.19 per common share to be paid on
October 22, 2014 to all shareholders of record as of the close of business on October 2, 2014. Any future dividends will be
subject to the approval of our Board of Directors.
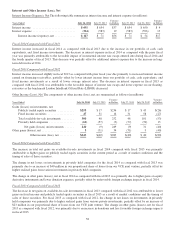
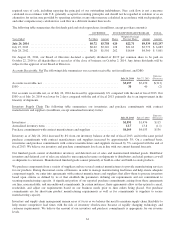
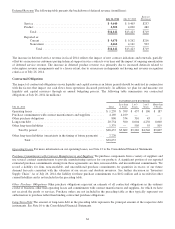
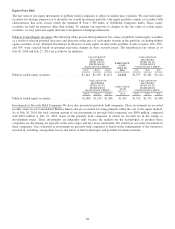
Accounts Receivable, Net The following table summarizes our accounts receivable, net (in millions), and DSO:
July 26, 2014 July 27, 2013
Increase
(Decrease)
Accounts receivable, net ................................................... $5,157 $5,470 $(313)
DSO ................................................................... 38 40 (2)
Our accounts receivable net, as of July 26, 2014 decreased by approximately 6% compared with the end of fiscal 2013. Our
DSO as of July 26, 2014 was lower by 2 days compared with the end of fiscal 2013, primarily due to an improvement in the
linearity of shipments.
Inventory Supply Chain The following table summarizes our inventories and purchase commitments with contract
manufacturers and suppliers (in millions, except annualized inventory turns):
July 26, 2014 July 27, 2013
Increase
(Decrease)
Inventories .............................................................. $1,591 $1,476 $115
Annualized inventory turns ................................................. 12.7 13.8 (1.1)
Purchase commitments with contract manufacturers and suppliers .................. $4,169 $4,033 $136
Inventory as of July 26, 2014 increased by 8% from our inventory balance at the end of fiscal 2013, and for the same period
purchase commitments with contract manufacturers and suppliers increased by approximately 3%. On a combined basis,
inventories and purchase commitments with contract manufacturers and suppliers increased by 5% compared with the end of
fiscal 2013. We believe our inventory and purchase commitments levels are in line with our current demand forecasts.
Our finished goods consist of distributor inventory and deferred cost of sales and manufactured finished goods. Distributor
inventory and deferred cost of sales are related to unrecognized revenue on shipments to distributors and retail partners as well
as shipments to customers. Manufactured finished goods consist primarily of build-to-order and build-to-stock products.
We purchase components from a variety of suppliers and use several contract manufacturers to provide manufacturing services
for our products. During the normal course of business, in order to manage manufacturing lead times and help ensure adequate
component supply, we enter into agreements with contract manufacturers and suppliers that allow them to procure inventory
based upon criteria as defined by us or that establish the parameters defining our requirements and our commitment to
securing manufacturing capacity. A significant portion of our reported purchase commitments arising from these agreements
are firm, noncancelable, and unconditional commitments. In certain instances, these agreements allow us the option to cancel,
reschedule, and adjust our requirements based on our business needs prior to firm orders being placed. Our purchase
commitments are for short-term product manufacturing requirements as well as for commitments to suppliers to secure
manufacturing capacity.
Inventory and supply chain management remain areas of focus as we balance the need to maintain supply chain flexibility to
help ensure competitive lead times with the risk of inventory obsolescence because of rapidly changing technology and
customer requirements. We believe the amount of our inventory and purchase commitments is appropriate for our revenue
levels.
61