Cisco 2014 Annual Report Download - page 61
Download and view the complete annual report
Please find page 61 of the 2014 Cisco annual report below. You can navigate through the pages in the report by either clicking on the pages listed below, or by using the keyword search tool below to find specific information within the annual report.-
 1
1 -
2
-
3
-
4
-
5
-
6
-
7
-
8
-
9
-
10
-
11
-
12
-
13
-
14
-
15
-
16
-
17
-
18
-
19
-
20
-
21
-
22
-
23
-
24
-
25
-
26
-
27
-
28
-
29
-
30
-
31
-
32
-
33
-
34
-
35
-
36
-
37
-
38
-
39
-
40
-
41
-
42
-
43
-
44
-
45
-
46
-
47
-
48
-
49
-
50
-
 51
51 -
 52
52 -
 53
53 -
 54
54 -
 55
55 -
 56
56 -
 57
57 -
 58
58 -
 59
59 -
 60
60 -
 61
61 -
 62
62 -
 63
63 -
 64
64 -
 65
65 -
 66
66 -
 67
67 -
 68
68 -
 69
69 -
 70
70 -
 71
71 -
72
-
73
-
74
-
75
-
76
-
77
-
78
-
79
-
80
-
81
-
82
-
83
-
84
-
85
-
86
-
87
-
88
-
89
-
90
-
91
-
92
-
93
-
94
-
95
-
96
-
97
-
98
-
99
-
100
-
101
-
102
-
103
-
104
-
105
-
106
-
107
-
108
-
109
-
110
-
111
-
112
-
113
-
114
-
115
-
116
-
117
-
118
-
119
-
120
-
121
-
122
-
123
-
124
-
125
-
126
-
127
-
128
-
129
-
130
-
131
-
132
-
133
-
134
-
135
-
136
-
137
-
138
-
139
-
140
 |
 |

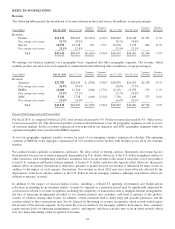
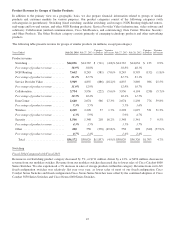
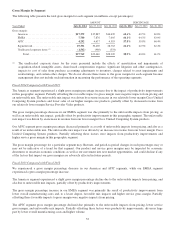
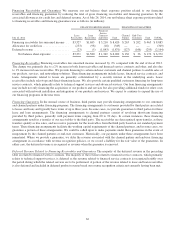
Gross Margin by Segment
The following table presents the total gross margin for each segment (in millions, except percentages):
AMOUNT PERCENTAGE
Years Ended July 26, 2014 July 27, 2013 July 28, 2012 July 26, 2014 July 27, 2013 July 28, 2012
Gross margin:
Americas ................................. $17,379 $17,887 $16,639 62.6% 62.5% 62.8%
EMEA ................................... 7,700 7,876 7,605 64.1% 64.5% 63.0%
APJC .................................... 4,252 4,637 4,519 57.8% 59.8% 60.4%
Segment total .............................. 29,331 30,400 28,763 62.2% 62.5% 62.4%
Unallocated corporate items (1) ................ (1,562) (960) (554)
Total ................................. $27,769 $29,440 $28,209 58.9% 60.6% 61.2%
(1) The unallocated corporate items for the years presented include the effects of amortization and impairments of
acquisition-related intangible assets, share-based compensation expense, significant litigation and other contingencies,
impacts to cost of sales from purchase accounting adjustments to inventory, charges related to asset impairments and
restructurings, and certain other charges. We do not allocate these items to the gross margin for each segment because
management does not include such information in measuring the performance of the operating segments.
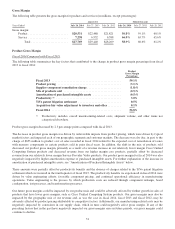
Fiscal 2014 Compared with Fiscal 2013
The Americas segment experienced a slight gross margin percentage increase due to the impact of productivity improvements
in this geographic segment. Partially offsetting this favorable impact to gross margin were negative impacts from pricing and
an unfavorable mix. The unfavorable mix impact was driven by revenue increases in our relatively lower margin Cisco Unified
Computing System products and lower sales of our higher margin core products, partially offset by decreased revenue from
our relatively lower margin Service Provider Video products.
The gross margin percentage decrease in our EMEA segment was due primarily to the unfavorable impacts from pricing, as
well as an unfavorable mix impact, partially offset by productivity improvements in this geographic segment. The unfavorable
mix impact was driven by an increase in revenue from our lower margin Cisco Unified Computing System products.
Our APJC segment gross margin percentage decreased primarily as a result of unfavorable impacts from pricing, and also as a
result of an unfavorable mix. The unfavorable mix impact was driven by an increase in revenue from our lower margin Cisco
Unified Computing System products. Partially offsetting these factors were impacts from productivity improvements and
higher service gross margin in this geographic segment.
The gross margin percentage for a particular segment may fluctuate, and period-to-period changes in such percentages may or
may not be indicative of a trend for that segment. Our product and service gross margins may be impacted by economic
downturns or uncertain economic conditions as well as our movement into new market opportunities, and could decline if any
of the factors that impact our gross margins are adversely affected in future periods.
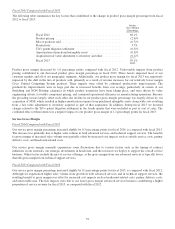
Fiscal 2013 Compared with Fiscal 2012
We experienced a gross margin percentage decrease in our Americas and APJC segments, while our EMEA segment
experienced a gross margin percentage increase.
The Americas segment experienced a slight gross margin percentage decline due to the unfavorable impacts from pricing, and
also due to unfavorable mix impacts, partially offset by productivity improvements.
The gross margin percentage increase in our EMEA segment was primarily the result of productivity improvements from
lower overall manufacturing costs and, to a lesser degree, favorable mix impacts and higher service gross margin. Partially
offsetting these favorable impacts to gross margin were negative impacts from pricing.
The APJC segment gross margin percentage declined due primarily to the unfavorable impacts from pricing, lower service
gross margin, and unfavorable mix impacts. Partially offsetting these factors were productivity improvements, driven in large
part by lower overall manufacturing costs and higher volume.
53