Cisco 2014 Annual Report Download - page 54
Download and view the complete annual report
Please find page 54 of the 2014 Cisco annual report below. You can navigate through the pages in the report by either clicking on the pages listed below, or by using the keyword search tool below to find specific information within the annual report.-
 1
1 -
2
-
3
-
4
-
5
-
6
-
7
-
8
-
9
-
10
-
11
-
12
-
13
-
14
-
15
-
16
-
17
-
18
-
19
-
20
-
21
-
22
-
23
-
24
-
25
-
26
-
27
-
28
-
29
-
30
-
31
-
32
-
33
-
34
-
35
-
36
-
37
-
38
-
39
-
40
-
41
-
42
-
43
-
 44
44 -
 45
45 -
 46
46 -
 47
47 -
 48
48 -
 49
49 -
 50
50 -
 51
51 -
 52
52 -
 53
53 -
 54
54 -
 55
55 -
 56
56 -
 57
57 -
 58
58 -
 59
59 -
 60
60 -
 61
61 -
 62
62 -
 63
63 -
 64
64 -
65
-
66
-
67
-
68
-
69
-
70
-
71
-
72
-
73
-
74
-
75
-
76
-
77
-
78
-
79
-
80
-
81
-
82
-
83
-
84
-
85
-
86
-
87
-
88
-
89
-
90
-
91
-
92
-
93
-
94
-
95
-
96
-
97
-
98
-
99
-
100
-
101
-
102
-
103
-
104
-
105
-
106
-
107
-
108
-
109
-
110
-
111
-
112
-
113
-
114
-
115
-
116
-
117
-
118
-
119
-
120
-
121
-
122
-
123
-
124
-
125
-
126
-
127
-
128
-
129
-
130
-
131
-
132
-
133
-
134
-
135
-
136
-
137
-
138
-
139
-
140
 |
 |

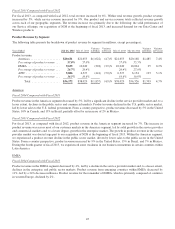
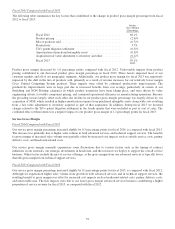
Fiscal 2013 Compared with Fiscal 2012
In fiscal 2013, we experienced a continuation of many of the macroeconomic challenges we faced in EMEA in fiscal 2012.
While we did see some improvements in most of the European economy as the fiscal year progressed, we continued to see
weakness in southern Europe throughout fiscal 2013. For fiscal 2013, as compared with fiscal 2012, product revenue in the
EMEA segment was flat, as growth in the commercial, service provider and public sector markets was offset by a decline in
the enterprise market. The growth in product revenue in the service provider market was due to our acquisition of NDS at the
beginning of fiscal 2013. From a country perspective, product revenue increased by 1% in the United Kingdom, 11% in
Russia, 4% in Switzerland, and 3% in Spain. These increases were offset by product revenue declines of 3% in each of
Germany and France and 13% in the Netherlands. Product revenue for Italy was flat year over year.
APJC
Fiscal 2014 Compared with Fiscal 2013
Product revenue in the APJC segment decreased by 7%, led by declines in the service provider and enterprise markets and, to a
lesser extent, a decline in the commercial market. We continued to experience declines in many of the emerging countries
within this segment, most notably in India which experienced a year-over-year product revenue decline of 15%. Other
countries that contributed to the weakness in this segment included Japan, Australia, and China, which experienced year-over-
year product revenue declines of 11%, 7%, and 6%, respectively.
Fiscal 2013 Compared with Fiscal 2012
For fiscal 2013, as compared with fiscal 2012, product revenue in the APJC segment increased by 3%. We experienced solid
product revenue growth in the commercial and service provider markets and, to a lesser degree, in the public sector market.
The growth in product revenue in the service provider market was due primarily to our acquisition of NDS at the beginning of
fiscal 2013. From a country perspective, product revenue increased by 3% in Australia, 34% in India, and 10% in South Korea.
These increases were partially offset by product revenue declines of 5% in China and 7% in Japan, reflecting certain
challenges that we faced in these countries during portions of fiscal 2013, most notably in the fourth quarter of fiscal 2013.
46