Cisco 2014 Annual Report Download - page 103
Download and view the complete annual report
Please find page 103 of the 2014 Cisco annual report below. You can navigate through the pages in the report by either clicking on the pages listed below, or by using the keyword search tool below to find specific information within the annual report.-
 1
1 -
2
-
3
-
4
-
5
-
6
-
7
-
8
-
9
-
10
-
11
-
12
-
13
-
14
-
15
-
16
-
17
-
18
-
19
-
20
-
21
-
22
-
23
-
24
-
25
-
26
-
27
-
28
-
29
-
30
-
31
-
32
-
33
-
34
-
35
-
36
-
37
-
38
-
39
-
40
-
41
-
42
-
43
-
44
-
45
-
46
-
47
-
48
-
49
-
50
-
51
-
52
-
53
-
54
-
55
-
56
-
57
-
58
-
59
-
60
-
61
-
62
-
63
-
64
-
65
-
66
-
67
-
68
-
69
-
70
-
71
-
72
-
73
-
74
-
75
-
76
-
77
-
78
-
79
-
80
-
81
-
82
-
83
-
84
-
85
-
86
-
87
-
88
-
89
-
90
-
91
-
92
-
 93
93 -
 94
94 -
 95
95 -
 96
96 -
 97
97 -
 98
98 -
 99
99 -
 100
100 -
 101
101 -
 102
102 -
 103
103 -
 104
104 -
 105
105 -
 106
106 -
 107
107 -
 108
108 -
 109
109 -
 110
110 -
 111
111 -
 112
112 -
 113
113 -
114
-
115
-
116
-
117
-
118
-
119
-
120
-
121
-
122
-
123
-
124
-
125
-
126
-
127
-
128
-
129
-
130
-
131
-
132
-
133
-
134
-
135
-
136
-
137
-
138
-
139
-
140
 |
 |

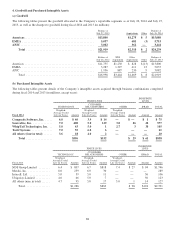
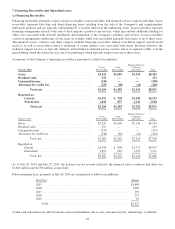
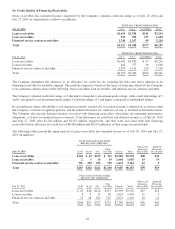
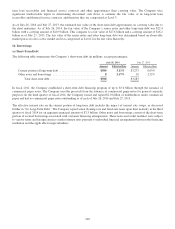
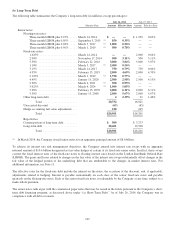
(d) Operating Leases
The Company provides financing of certain equipment through operating leases, and the amounts are included in property and
equipment in the Consolidated Balance Sheets. Amounts relating to equipment on operating lease assets and the associated
accumulated depreciation are summarized as follows (in millions):
July 26, 2014 July 27, 2013
Operating lease assets .............................................................. $ 362 $ 326
Accumulated depreciation ........................................................... (202) (203)
Operating lease assets, net ....................................................... $ 160 $ 123
Minimum future rentals on non-cancelable operating leases at July 26, 2014 are approximately $0.2 billion per year for fiscal
2015, $0.1 billion for fiscal 2016, and less than $0.1 billion per year for each of fiscal 2017 through fiscal 2019.
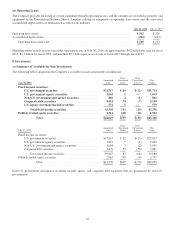
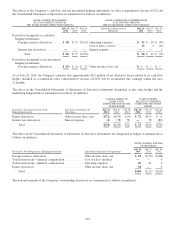
8. Investments
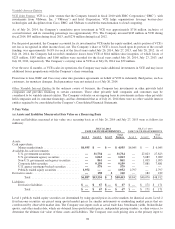
(a) Summary of Available-for-Sale Investments
The following tables summarize the Company’s available-for-sale investments (in millions):
July 26, 2014
Amortized
Cost
Gross
Unrealized
Gains
Gross
Unrealized
Losses
Fair
Value
Fixed income securities:
U.S. government securities ........................... $31,717 $ 29 $ (12) $31,734
U.S. government agency securities ..................... 1,062 1 — 1,063
Non-U.S. government and agency securities ............. 860 2 (1) 861
Corporate debt securities ............................ 9,092 74 (7) 9,159
U.S. agency mortgage-backed securities ................ 574 5 — 579
Total fixed income securities ...................... 43,305 111 (20) 43,396
Publicly traded equity securities ........................... 1,314 648 (10) 1,952
Total ...................................... $44,619 $759 $ (30) $45,348
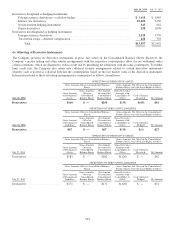
July 27, 2013
Amortized
Cost
Gross
Unrealized
Gains
Gross
Unrealized
Losses
Fair
Value
Fixed income securities:
U.S. government securities ............................ $27,814 $ 22 $ (13) $27,823
U.S. government agency securities ...................... 3,083 7 (1) 3,089
Non-U.S. government and agency securities ............... 1,094 3 (2) 1,095
Corporate debt securities .............................. 7,876 55 (50) 7,881
Total fixed income securities ....................... 39,867 87 (66) 39,888
Publicly traded equity securities ............................ 2,063 738 (4) 2,797
Total ...................................... $41,930 $825 $ (70) $42,685
Non-U.S. government and agency securities include agency and corporate debt securities that are guaranteed by non-U.S.
governments.
95