Cisco 2014 Annual Report Download - page 45
Download and view the complete annual report
Please find page 45 of the 2014 Cisco annual report below. You can navigate through the pages in the report by either clicking on the pages listed below, or by using the keyword search tool below to find specific information within the annual report.-
 1
1 -
2
-
3
-
4
-
5
-
6
-
7
-
8
-
9
-
10
-
11
-
12
-
13
-
14
-
15
-
16
-
17
-
18
-
19
-
20
-
21
-
22
-
23
-
24
-
25
-
26
-
27
-
28
-
29
-
30
-
31
-
32
-
33
-
34
-
 35
35 -
 36
36 -
 37
37 -
 38
38 -
 39
39 -
 40
40 -
 41
41 -
 42
42 -
 43
43 -
 44
44 -
 45
45 -
 46
46 -
 47
47 -
 48
48 -
 49
49 -
 50
50 -
 51
51 -
 52
52 -
 53
53 -
 54
54 -
 55
55 -
56
-
57
-
58
-
59
-
60
-
61
-
62
-
63
-
64
-
65
-
66
-
67
-
68
-
69
-
70
-
71
-
72
-
73
-
74
-
75
-
76
-
77
-
78
-
79
-
80
-
81
-
82
-
83
-
84
-
85
-
86
-
87
-
88
-
89
-
90
-
91
-
92
-
93
-
94
-
95
-
96
-
97
-
98
-
99
-
100
-
101
-
102
-
103
-
104
-
105
-
106
-
107
-
108
-
109
-
110
-
111
-
112
-
113
-
114
-
115
-
116
-
117
-
118
-
119
-
120
-
121
-
122
-
123
-
124
-
125
-
126
-
127
-
128
-
129
-
130
-
131
-
132
-
133
-
134
-
135
-
136
-
137
-
138
-
139
-
140
 |
 |
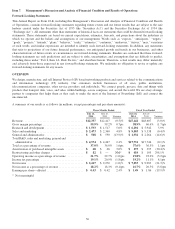
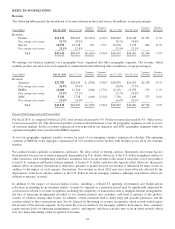
Fiscal 2014 Compared with Fiscal 2013—Financial Performance
Total revenue decreased by 3% as compared with fiscal 2013. Within the total revenue change, product revenue decreased 5%
and service revenue increased 4%. Total gross margin decreased by 1.7 percentage points, driven by unfavorable impacts from
pricing and mix partially offset by productivity improvements and also due to the $655 million charge to product cost of sales
recorded in fiscal 2014 related to the expected cost of remediation of issues with memory components in certain products sold
in prior fiscal years. Despite a slight year-over-year decline in absolute dollars, research and development, sales and
marketing, and general and administrative expenses, collectively, increased by 1.1 percentage points as a percentage of
revenue due to the decline in revenue. Operating income as a percentage of revenue decreased by 3.2 percentage points.
Diluted earnings per share decreased by 20% from the prior year, driven by a 21% decrease in net income. The decrease in net
income in fiscal 2014 compared with fiscal 2013 was also attributable to net tax benefits in fiscal 2013 related to a settlement
with the IRS and reinstatement of the U.S. Federal R&D tax credit.
Fiscal 2014 Compared with Fiscal 2013—Business Summary
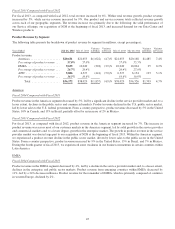
In fiscal 2014, revenue decreased by $1.5 billion as compared with fiscal 2013. Revenue from the Americas decreased by $0.9
billion, driven by lower product revenue in most countries in this segment including the United States. While we experienced
relative stability across Europe, EMEA revenue decreased $0.2 billion, led by product revenue declines in Russia as well as
various other countries in this segment. Revenue in our APJC segment decreased $0.4 billion, led by product revenue declines
in Japan and India. The weakness we encountered in emerging countries throughout the world in the later part of fiscal 2013
continued during fiscal 2014. The emerging countries of Brazil, Russia, India, China, and Mexico (“BRICM”), in the
aggregate, experienced an 11% product revenue decline, with declines across all of our customer markets. We believe that the
product revenue declines in many of these emerging countries were driven by the impact of economic and geopolitical
challenges in these countries. While we saw some improvement in our business momentum in emerging countries in the
second and third quarters of fiscal 2014, we experienced a decline in our business momentum in these countries during the
fourth quarter of fiscal 2014.
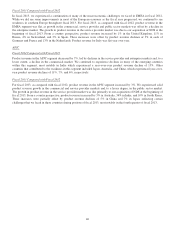
In fiscal 2014, product revenue declined across all customer markets, with the most significant decline in the service provider
market. Within the service provider market, the largest impacts came from the continued product revenue decline in our
Service Provider Video category and the ongoing decline of product revenue in the emerging countries.
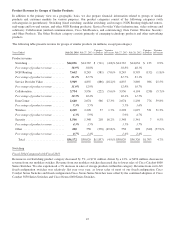
From a product category perspective, the product revenue decrease of 5% year-over-year was driven in large part by the lower
product revenue within our core routing and switching product categories. While we saw improvement in business momentum
with respect to high-end routers during the second half of fiscal 2014, there was only a limited revenue contribution related to
some of our recently introduced products, as product transitions in this area are still in their early stages. The effects of these
product transitions, combined with other challenges, led to a decrease in NGN Routing revenue of 7%. We also experienced a
5% decrease in revenue from our Switching products. The other major product categories experienced revenue changes
ranging from an 18% decrease in Service Provider Video to a 27% increase in Data Center. The decrease in revenue from our
Service Provider Video products was driven largely by a decrease in revenue from sales of set-top boxes. Partially offsetting
the decline in product revenue was an increase in service revenue. Service revenue increased by 4%, reflecting continued
slower growth compared with prior years, which we believe was attributable to the impact of the declines in product revenue
in recent periods.
As we continue to focus on investing in growth, innovation, and talent, while managing costs and driving efficiencies, we
announced a restructuring plan that will impact up to 6,000 employees, representing approximately 8% of our global
workforce. We expect to reinvest substantially all of the cost savings from the restructuring actions in our key growth areas
such as data center, software, security, and cloud.
In summary, while we saw some improved business momentum in the second half of fiscal 2014, we experienced many
challenges during fiscal 2014 including reduced spending by our service provider customers, weakness in emerging countries,
the impact of product transitions, and a conservative approach to IT-related capital spending by customers. We expect that the
challenges in the emerging countries, the service provider customer market, and product transitions in Switching and NGN
Routing may continue for at least the next several quarters.
37