Cisco 2014 Annual Report Download - page 59
Download and view the complete annual report
Please find page 59 of the 2014 Cisco annual report below. You can navigate through the pages in the report by either clicking on the pages listed below, or by using the keyword search tool below to find specific information within the annual report.-
 1
1 -
2
-
3
-
4
-
5
-
6
-
7
-
8
-
9
-
10
-
11
-
12
-
13
-
14
-
15
-
16
-
17
-
18
-
19
-
20
-
21
-
22
-
23
-
24
-
25
-
26
-
27
-
28
-
29
-
30
-
31
-
32
-
33
-
34
-
35
-
36
-
37
-
38
-
39
-
40
-
41
-
42
-
43
-
44
-
45
-
46
-
47
-
48
-
 49
49 -
 50
50 -
 51
51 -
 52
52 -
 53
53 -
 54
54 -
 55
55 -
 56
56 -
 57
57 -
 58
58 -
 59
59 -
 60
60 -
 61
61 -
 62
62 -
 63
63 -
 64
64 -
 65
65 -
 66
66 -
 67
67 -
 68
68 -
 69
69 -
70
-
71
-
72
-
73
-
74
-
75
-
76
-
77
-
78
-
79
-
80
-
81
-
82
-
83
-
84
-
85
-
86
-
87
-
88
-
89
-
90
-
91
-
92
-
93
-
94
-
95
-
96
-
97
-
98
-
99
-
100
-
101
-
102
-
103
-
104
-
105
-
106
-
107
-
108
-
109
-
110
-
111
-
112
-
113
-
114
-
115
-
116
-
117
-
118
-
119
-
120
-
121
-
122
-
123
-
124
-
125
-
126
-
127
-
128
-
129
-
130
-
131
-
132
-
133
-
134
-
135
-
136
-
137
-
138
-
139
-
140
 |
 |

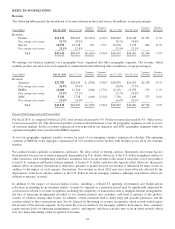
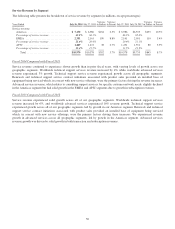
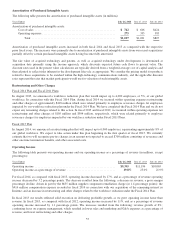
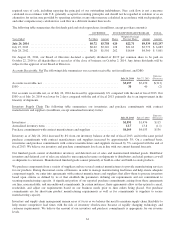
Gross Margin
The following table presents the gross margin for products and services (in millions, except percentages):
AMOUNT PERCENTAGE
Years Ended July 26, 2014 July 27, 2013 July 28, 2012 July 26, 2014 July 27, 2013 July 28, 2012
Gross margin:
Product ........................... $20,531 $22,488 $21,821 56.8% 59.1% 60.1%
Service ........................... 7,238 6,952 6,388 66.0% 65.7% 65.6%
Total ......................... $27,769 $29,440 $28,209 58.9% 60.6% 61.2%
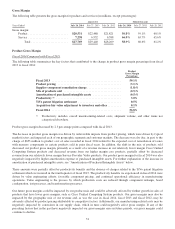
Product Gross Margin
Fiscal 2014 Compared with Fiscal 2013
The following table summarizes the key factors that contributed to the change in product gross margin percentage from fiscal
2013 to fiscal 2014:
Product
Gross Margin
Percentage
Fiscal 2013 ............................................... 59.1%
Product pricing ........................................... (3.1)%
Supplier component remediation charge ....................... (1.8)%
Mix of products sold ....................................... (0.5)%
Amortization of purchased intangible assets ................... (0.5)%
Productivity (1) ............................................ 3.0%
TiVo patent litigation settlement ............................. 0.5%
Acquisition fair value adjustment to inventory and other ......... 0.1%
Fiscal 2014 ............................................... 56.8%
(1) Productivity includes overall manufacturing-related costs, shipment volume, and other items not
categorized elsewhere.
Product gross margin decreased by 2.3 percentage points compared with fiscal 2013.
The decrease in product gross margin was driven by unfavorable impacts from product pricing, which were driven by typical
market factors and impacted each of our geographic segments and customer markets. The decrease was also due, in part, to the
charge of $655 million to product cost of sales recorded in fiscal 2014 related to the expected cost of remediation of issues
with memory components in certain products sold in prior fiscal years. In addition, the shift in the mix of products sold
decreased our product gross margin, primarily as a result of a revenue increase in our relatively lower margin Cisco Unified
Computing System products and decreased revenue from our higher margin core products, partially offset by decreased
revenue from our relatively lower margin Service Provider Video products. Our product gross margin for fiscal 2014 was also
negatively impacted by higher amortization expense of purchased intangible assets. For further explanation of the increase in
amortization of purchased intangible assets, see “Amortization of Purchased Intangible Assets” below.
These amounts were partially offset by productivity benefits and the absence of charges related to the TiVo patent litigation
settlement which we incurred in the fourth quarter of fiscal 2013. The productivity benefits we experienced in fiscal 2014 were
driven by value engineering efforts; favorable component pricing; and continued operational efficiency in manufacturing
operations. Value engineering is the process by which production costs are reduced through component redesign, board
configuration, test processes, and transformation processes.
Our future gross margins could be impacted by our product mix and could be adversely affected by further growth in sales of
products that have lower gross margins, such as Cisco Unified Computing System products. Our gross margins may also be
impacted by the geographic mix of our revenue and, as was the case in fiscal 2014, fiscal 2013 and fiscal 2012, may be
adversely affected by product pricing attributable to competitive factors. Additionally, our manufacturing-related costs may be
negatively impacted by constraints in our supply chain, which in turn could negatively affect gross margin. If any of the
preceding factors that in the past have negatively impacted our gross margins arise in future periods, our gross margins could
continue to decline.
51