Cisco 2014 Annual Report Download - page 55
Download and view the complete annual report
Please find page 55 of the 2014 Cisco annual report below. You can navigate through the pages in the report by either clicking on the pages listed below, or by using the keyword search tool below to find specific information within the annual report.-
 1
1 -
2
-
3
-
4
-
5
-
6
-
7
-
8
-
9
-
10
-
11
-
12
-
13
-
14
-
15
-
16
-
17
-
18
-
19
-
20
-
21
-
22
-
23
-
24
-
25
-
26
-
27
-
28
-
29
-
30
-
31
-
32
-
33
-
34
-
35
-
36
-
37
-
38
-
39
-
40
-
41
-
42
-
43
-
44
-
 45
45 -
 46
46 -
 47
47 -
 48
48 -
 49
49 -
 50
50 -
 51
51 -
 52
52 -
 53
53 -
 54
54 -
 55
55 -
 56
56 -
 57
57 -
 58
58 -
 59
59 -
 60
60 -
 61
61 -
 62
62 -
 63
63 -
 64
64 -
 65
65 -
66
-
67
-
68
-
69
-
70
-
71
-
72
-
73
-
74
-
75
-
76
-
77
-
78
-
79
-
80
-
81
-
82
-
83
-
84
-
85
-
86
-
87
-
88
-
89
-
90
-
91
-
92
-
93
-
94
-
95
-
96
-
97
-
98
-
99
-
100
-
101
-
102
-
103
-
104
-
105
-
106
-
107
-
108
-
109
-
110
-
111
-
112
-
113
-
114
-
115
-
116
-
117
-
118
-
119
-
120
-
121
-
122
-
123
-
124
-
125
-
126
-
127
-
128
-
129
-
130
-
131
-
132
-
133
-
134
-
135
-
136
-
137
-
138
-
139
-
140
 |
 |

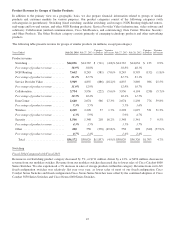
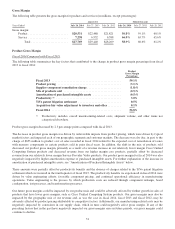
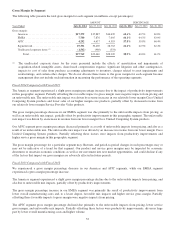
Product Revenue by Groups of Similar Products
In addition to the primary view on a geographic basis, we also prepare financial information related to groups of similar
products and customer markets for various purposes. Our product categories consist of the following categories (with
subcategories in parentheses): Switching (fixed switching, modular switching, and storage); NGN Routing (high-end routers,
mid-range and low-end routers, and other NGN Routing products); Service Provider Video (infrastructure, video software and
solutions); Collaboration (unified communications, Cisco TelePresence, and conferencing); Data Center; Wireless; Security;
and Other Products. The Other Products category consists primarily of emerging technology products and other networking
products.
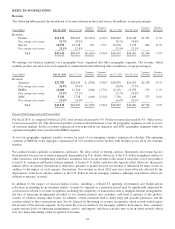
The following table presents revenue for groups of similar products (in millions, except percentages):
Years Ended July 26, 2014 July 27, 2013
Variance
in Dollars
Variance
in Percent July 27, 2013 July 28, 2012
Variance
in Dollars
Variance
in Percent
Product revenue:
Switching ......................... $14,056 $14,767 $ (711) (4.8)% $14,767 $14,634 $ 133 0.9%
Percentage of product revenue ........ 38.9% 38.8% 38.8% 40.3%
NGN Routing ..................... 7,662 8,243 (581) (7.0)% 8,243 8,395 (152) (1.8)%
Percentage of product revenue ........ 21.2% 21.7% 21.7% 23.1%
Service Provider Video .............. 3,969 4,855 (886) (18.2)% 4,855 3,869 986 25.5%
Percentage of product revenue ........ 11.0% 12.8% 12.8% 10.7%
Collaboration ...................... 3,734 3,956 (222) (5.6)% 3,956 4,194 (238) (5.7)%
Percentage of product revenue ........ 10.3% 10.4% 10.4% 11.5%
Data Center ....................... 2,640 2,074 566 27.3% 2,074 1,298 776 59.8%
Percentage of product revenue ........ 7.3% 5.5% 5.5% 3.6%
Wireless .......................... 2,265 2,228 37 1.7% 2,228 1,697 531 31.3%
Percentage of product revenue ........ 6.3% 5.9% 5.9% 4.7%
Security .......................... 1,566 1,348 218 16.2% 1,348 1,341 7 0.5%
Percentage of product revenue ........ 4.3% 3.5% 3.5% 3.7%
Other ............................ 280 558 (278) (49.8)% 558 898 (340) (37.9)%
Percentage of product revenue ........ 0.7% 1.4% 1.4% 2.4%
Total .......................... $36,172 $38,029 $(1,857) (4.9)% $38,029 $36,326 $1,703 4.7%
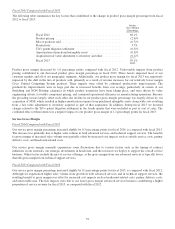
Switching
Fiscal 2014 Compared with Fiscal 2013
Revenue in our Switching product category decreased by 5%, or $711 million, driven by a 12%, or $656 million, decrease in
revenue from our modular switches. Revenue from our modular switches decreased due to lower sales of Cisco Catalyst 6000
Series Switches. We also experienced a 3% decrease in sales of storage products within this category. Revenue from our LAN
fixed-configuration switches was relatively flat year over year, as lower sales of most of our fixed-configuration Cisco
Catalyst Series Switches and fixed-configuration Cisco Nexus Series Switches were offset by the continued adoption of Cisco
Catalyst 3850 Series Switches and Cisco Nexus 6000 Series Switches.
47