Cisco 2014 Annual Report Download - page 53
Download and view the complete annual report
Please find page 53 of the 2014 Cisco annual report below. You can navigate through the pages in the report by either clicking on the pages listed below, or by using the keyword search tool below to find specific information within the annual report.-
 1
1 -
2
-
3
-
4
-
5
-
6
-
7
-
8
-
9
-
10
-
11
-
12
-
13
-
14
-
15
-
16
-
17
-
18
-
19
-
20
-
21
-
22
-
23
-
24
-
25
-
26
-
27
-
28
-
29
-
30
-
31
-
32
-
33
-
34
-
35
-
36
-
37
-
38
-
39
-
40
-
41
-
42
-
 43
43 -
 44
44 -
 45
45 -
 46
46 -
 47
47 -
 48
48 -
 49
49 -
 50
50 -
 51
51 -
 52
52 -
 53
53 -
 54
54 -
 55
55 -
 56
56 -
 57
57 -
 58
58 -
 59
59 -
 60
60 -
 61
61 -
 62
62 -
 63
63 -
64
-
65
-
66
-
67
-
68
-
69
-
70
-
71
-
72
-
73
-
74
-
75
-
76
-
77
-
78
-
79
-
80
-
81
-
82
-
83
-
84
-
85
-
86
-
87
-
88
-
89
-
90
-
91
-
92
-
93
-
94
-
95
-
96
-
97
-
98
-
99
-
100
-
101
-
102
-
103
-
104
-
105
-
106
-
107
-
108
-
109
-
110
-
111
-
112
-
113
-
114
-
115
-
116
-
117
-
118
-
119
-
120
-
121
-
122
-
123
-
124
-
125
-
126
-
127
-
128
-
129
-
130
-
131
-
132
-
133
-
134
-
135
-
136
-
137
-
138
-
139
-
140
 |
 |

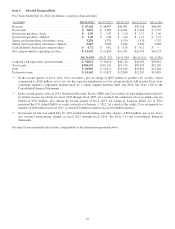
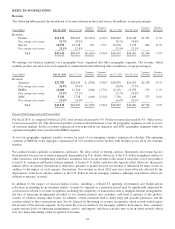
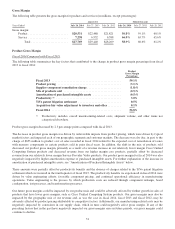
Fiscal 2013 Compared with Fiscal 2012
For fiscal 2013, as compared with fiscal 2012, total revenue increased by 6%. Within total revenue growth, product revenue
increased by 5%, while service revenue increased by 9%. Our product and service revenue totals reflected revenue growth
across each of our geographic segments. The revenue increase was primarily due to the following: the solid performance of
our Service offerings, our acquisition of NDS at the beginning of fiscal 2013, and increased demand for our Data Center and
Wireless products.
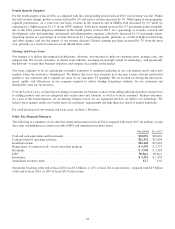
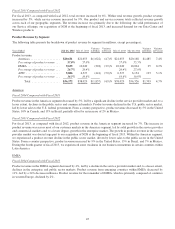
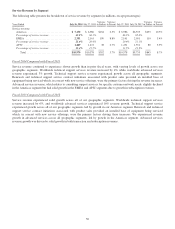
Product Revenue by Segment
The following table presents the breakdown of product revenue by segment (in millions, except percentages):
Years Ended July 26, 2014 July 27, 2013
Variance
in Dollars
Variance
in Percent July 27, 2013 July 28, 2012
Variance
in Dollars
Variance
in Percent
Product revenue:
Americas .................... $20,631 $21,653 $(1,022) (4.7)% $21,653 $20,168 $1,485 7.4%
Percentage of product revenue ... 57.0% 57.0% 57.0% 55.5%
EMEA ...................... 9,655 10,049 (394) (3.9)% 10,049 10,024 25 0.2%
Percentage of product revenue ... 26.7% 26.4% 26.4% 27.6%
APJC ....................... 5,886 6,327 (441) (7.0)% 6,327 6,134 193 3.1%
Percentage of product revenue ... 16.3% 16.6% 16.6% 16.9%
Total ................... $36,172 $38,029 $(1,857) (4.9)% $38,029 $36,326 $1,703 4.7%
Americas
Fiscal 2014 Compared with Fiscal 2013
Product revenue in the Americas segment decreased by 5%, led by a significant decline in the service provider market and, to a
lesser extent, declines in the public sector and commercial markets. Product revenue declined in the U.S. public sector market,
led by lower sales to the U.S. federal government. From a country perspective, product revenue decreased by 5% in the United
States, 10% in Canada, and 13% in Brazil, partially offset by an increase of 2% in Mexico.
Fiscal 2013 Compared with Fiscal 2012
For fiscal 2013, as compared with fiscal 2012, product revenue in the Americas segment increased by 7%. The increase in
product revenue was across most of our customer markets in the Americas segment, led by solid growth in the service provider
and commercial markets and, to a lesser degree, growth in the enterprise market. The growth in product revenue in the service
provider market was due in large part to our acquisition of NDS at the beginning of fiscal 2013. Within the Americas segment,
we experienced a product revenue decline in the public sector market, driven by lower sales to the public sector in the United
States. From a country perspective, product revenue increased by 9% in the United States, 13% in Brazil, and 7% in Mexico.
During the fourth quarter of fiscal 2013, we experienced some weakness in our business momentum in certain countries within
Latin America.
EMEA
Fiscal 2014 Compared with Fiscal 2013
Product revenue in the EMEA segment decreased by 4%, led by a decline in the service provider market and, to a lesser extent,
declines in the enterprise and public sector markets. Product revenue from emerging countries within EMEA decreased by
11%, led by a 24% decrease in Russia. Product revenue for the remainder of EMEA, which is primarily composed of countries
in western Europe, declined by 2%.
45