Cisco 2014 Annual Report Download - page 101
Download and view the complete annual report
Please find page 101 of the 2014 Cisco annual report below. You can navigate through the pages in the report by either clicking on the pages listed below, or by using the keyword search tool below to find specific information within the annual report.-
 1
1 -
2
-
3
-
4
-
5
-
6
-
7
-
8
-
9
-
10
-
11
-
12
-
13
-
14
-
15
-
16
-
17
-
18
-
19
-
20
-
21
-
22
-
23
-
24
-
25
-
26
-
27
-
28
-
29
-
30
-
31
-
32
-
33
-
34
-
35
-
36
-
37
-
38
-
39
-
40
-
41
-
42
-
43
-
44
-
45
-
46
-
47
-
48
-
49
-
50
-
51
-
52
-
53
-
54
-
55
-
56
-
57
-
58
-
59
-
60
-
61
-
62
-
63
-
64
-
65
-
66
-
67
-
68
-
69
-
70
-
71
-
72
-
73
-
74
-
75
-
76
-
77
-
78
-
79
-
80
-
81
-
82
-
83
-
84
-
85
-
86
-
87
-
88
-
89
-
90
-
 91
91 -
 92
92 -
 93
93 -
 94
94 -
 95
95 -
 96
96 -
 97
97 -
 98
98 -
 99
99 -
 100
100 -
 101
101 -
 102
102 -
 103
103 -
 104
104 -
 105
105 -
 106
106 -
 107
107 -
 108
108 -
 109
109 -
 110
110 -
 111
111 -
112
-
113
-
114
-
115
-
116
-
117
-
118
-
119
-
120
-
121
-
122
-
123
-
124
-
125
-
126
-
127
-
128
-
129
-
130
-
131
-
132
-
133
-
134
-
135
-
136
-
137
-
138
-
139
-
140
 |
 |

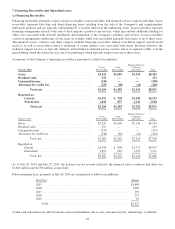
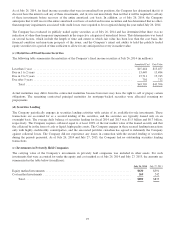
(b) Credit Quality of Financing Receivables
Gross receivables less unearned income categorized by the Company’s internal credit risk rating as of July 26, 2014 and
July 27, 2013 are summarized as follows (in millions):
INTERNAL CREDIT RISK RATING
July 26, 2014 1to4 5to6 7 and Higher Total
Lease receivables ...................................................... $1,615 $1,538 $141 $3,294
Loan receivables ...................................................... 953 593 137 1,683
Financed service contracts and other ..................................... 1,744 1,367 99 3,210
Total ................................................................ $4,312 $3,498 $377 $8,187
INTERNAL CREDIT RISK RATING
July 27, 2013 1to4 5to6 7 and Higher Total
Lease receivables ...................................................... $1,681 $1,482 $ 93 $3,256
Loan receivables ....................................................... 842 777 30 1,649
Financed service contracts and other ....................................... 1,876 1,141 119 3,136
Total ................................................................ $4,399 $3,400 $242 $8,041
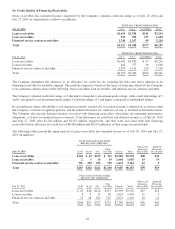
The Company determines the adequacy of its allowance for credit loss by assessing the risks and losses inherent in its
financing receivables by portfolio segment. The portfolio segment is based on the types of financing offered by the Company
to its customers, which consist of the following: lease receivables, loan receivables, and financed service contracts and other.
The Company’s internal credit risk ratings of 1 through 4 correspond to investment-grade ratings, while credit risk ratings of 5
and 6 correspond to non-investment grade ratings. Credit risk ratings of 7 and higher correspond to substandard ratings.
In circumstances when collectibility is not deemed reasonably assured, the associated revenue is deferred in accordance with
the Company’s revenue recognition policies, and the related allowance for credit loss, if any, is included in deferred revenue.
The Company also records deferred revenue associated with financing receivables when there are remaining performance
obligations, as it does for financed service contracts. Total allowances for credit loss and deferred revenue as of July 26, 2014
and July 27, 2013 were $2,220 million and $2,453 million, respectively, and they were associated with total financing
receivables before allowance for credit loss of $8,420 million and $8,292 million as of their respective period ends.
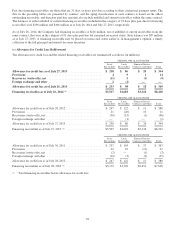
The following tables present the aging analysis of gross receivables less unearned income as of July 26, 2014 and July 27,
2013 (in millions):
DAYS PAST DUE (INCLUDES
BILLED AND UNBILLED)
July 26, 2014 31-60 61-90 91+
Total
Past Due Current Total
Nonaccrual
Financing
Receivables
Impaired
Financing
Receivables
Lease receivables .......................... $104 $ 43 $165 $ 312 $2,982 $3,294 $48 $41
Loan receivables ........................... 2 1 16 19 1,664 1,683 19 19
Financed service contracts and other .......... 301 238 230 769 2,441 3,210 12 9
Total ..................................... $407 $282 $411 $1,100 $7,087 $8,187 $79 $69
DAYS PAST DUE (INCLUDES
BILLED AND UNBILLED)
July 27, 2013 31-60 61-90 91+
Total
Past Due Current Total
Nonaccrual
Financing
Receivables
Impaired
Financing
Receivables
Lease receivables ........................... $ 85 $48 $124 $257 $2,999 $3,256 $27 $22
Loan receivables ............................ 6 3 11 20 1,629 1,649 11 9
Financed service contracts and other ............ 75 48 392 515 2,621 3,136 18 11
Total ..................................... $166 $99 $527 $792 $7,249 $8,041 $56 $42
93