Cincinnati Bell 2014 Annual Report Download - page 45
Download and view the complete annual report
Please find page 45 of the 2014 Cincinnati Bell annual report below. You can navigate through the pages in the report by either clicking on the pages listed below, or by using the keyword search tool below to find specific information within the annual report.-
 1
1 -
2
-
3
-
4
-
5
-
6
-
7
-
8
-
9
-
10
-
11
-
12
-
13
-
14
-
15
-
16
-
17
-
18
-
19
-
20
-
21
-
22
-
23
-
24
-
25
-
26
-
27
-
28
-
29
-
30
-
31
-
32
-
33
-
34
-
 35
35 -
 36
36 -
 37
37 -
 38
38 -
 39
39 -
 40
40 -
 41
41 -
 42
42 -
 43
43 -
 44
44 -
 45
45 -
 46
46 -
 47
47 -
 48
48 -
 49
49 -
 50
50 -
 51
51 -
 52
52 -
 53
53 -
 54
54 -
 55
55 -
56
-
57
-
58
-
59
-
60
-
61
-
62
-
63
-
64
-
65
-
66
-
67
-
68
-
69
-
70
-
71
-
72
-
73
-
74
-
75
-
76
-
77
-
78
-
79
-
80
-
81
-
82
-
83
-
84
-
85
-
86
-
87
-
88
-
89
-
90
-
91
-
92
-
93
-
94
-
95
-
96
-
97
-
98
-
99
-
100
-
101
-
102
-
103
-
104
-
105
-
106
-
107
-
108
-
109
-
110
-
111
-
112
-
113
-
114
-
115
-
116
-
117
-
118
-
119
-
120
-
121
-
122
-
123
-
124
-
125
-
126
-
127
-
128
-
129
-
130
-
131
-
132
-
133
-
134
-
135
-
136
-
137
-
138
-
139
-
140
-
141
-
142
-
143
-
144
-
145
-
146
-
147
-
148
-
149
-
150
-
151
-
152
-
153
-
154
-
155
-
156
-
157
-
158
-
159
-
160
-
161
-
162
-
163
-
164
-
165
-
166
-
167
-
168
-
169
-
170
-
171
-
172
-
173
-
174
-
175
-
176
-
177
-
178
-
179
-
180
-
181
-
182
-
183
-
184
-
185
-
186
-
187
-
188
-
189
-
190
-
191
-
192
-
193
 |
 |

Table of Contents
Form 10-K Part II
Cincinnati Bell Inc.
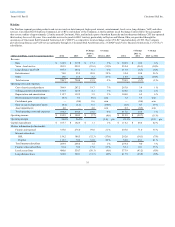
Corporate is comprised primarily of general and administrative costs that have not been allocated to the business segments. Corporate costs totaled $20.2
million in 2014, $56.3 million in 2013, and $34.7 million in 2012.
Corporate costs decreased by $36.1 million compared to the prior year, driven largely by the $42.6 million of transaction related compensation payments
recorded in 2013 as a result of the successful IPO of CyrusOne. Restructuring charges were down $3.6 million in 2014 due primarily to severance and
consulting fees incurred during 2013 associated with a workforce optimization initiative. The decrease was partially offset by $4.5 million in additional
stock-based compensation expense as a result of changes in our stock price. Employee related costs were also up in 2014 as a result of increased healthcare,
disability and insurance costs.
Corporate costs increased by $21.6 million compared to the prior year, driven largely by the $42.6 million of transaction related compensation payments as a
result of the successful IPO of CyrusOne. Transaction costs were down $4.7 million in 2013 as the costs in 2012 related to legal and consulting fees incurred
in preparation for the IPO of CyrusOne. In 2013, transaction costs related to finalizing the CyrusOne IPO and investigating strategic alternatives for our
Wireless business. The increase was also partially offset by a $5.6 million stock compensation mark-to-market gain in 2013 compared to a $7.9 million stock
compensation mark-to-market expense in 2012. The remaining offset is primarily due to decreased headcount related costs as a result of cost-out initiatives.
45