Cincinnati Bell 2014 Annual Report Download - page 42
Download and view the complete annual report
Please find page 42 of the 2014 Cincinnati Bell annual report below. You can navigate through the pages in the report by either clicking on the pages listed below, or by using the keyword search tool below to find specific information within the annual report.-
 1
1 -
2
-
3
-
4
-
5
-
6
-
7
-
8
-
9
-
10
-
11
-
12
-
13
-
14
-
15
-
16
-
17
-
18
-
19
-
20
-
21
-
22
-
23
-
24
-
25
-
26
-
27
-
28
-
29
-
30
-
31
-
 32
32 -
 33
33 -
 34
34 -
 35
35 -
 36
36 -
 37
37 -
 38
38 -
 39
39 -
 40
40 -
 41
41 -
 42
42 -
 43
43 -
 44
44 -
 45
45 -
 46
46 -
 47
47 -
 48
48 -
 49
49 -
 50
50 -
 51
51 -
 52
52 -
53
-
54
-
55
-
56
-
57
-
58
-
59
-
60
-
61
-
62
-
63
-
64
-
65
-
66
-
67
-
68
-
69
-
70
-
71
-
72
-
73
-
74
-
75
-
76
-
77
-
78
-
79
-
80
-
81
-
82
-
83
-
84
-
85
-
86
-
87
-
88
-
89
-
90
-
91
-
92
-
93
-
94
-
95
-
96
-
97
-
98
-
99
-
100
-
101
-
102
-
103
-
104
-
105
-
106
-
107
-
108
-
109
-
110
-
111
-
112
-
113
-
114
-
115
-
116
-
117
-
118
-
119
-
120
-
121
-
122
-
123
-
124
-
125
-
126
-
127
-
128
-
129
-
130
-
131
-
132
-
133
-
134
-
135
-
136
-
137
-
138
-
139
-
140
-
141
-
142
-
143
-
144
-
145
-
146
-
147
-
148
-
149
-
150
-
151
-
152
-
153
-
154
-
155
-
156
-
157
-
158
-
159
-
160
-
161
-
162
-
163
-
164
-
165
-
166
-
167
-
168
-
169
-
170
-
171
-
172
-
173
-
174
-
175
-
176
-
177
-
178
-
179
-
180
-
181
-
182
-
183
-
184
-
185
-
186
-
187
-
188
-
189
-
190
-
191
-
192
-
193
 |
 |

Table of Contents
Form 10-K Part II
Cincinnati Bell Inc.
The cost of services and products decrease is largely due to significantly fewer subscribers and lower roaming charges and handset subsidies. In the fourth
quarter of 2014, we entered into an agreement to lease back the spectrum license for $8.00. As the agreement does not represent fair value of the lease the
Company estimated fair value and records a monthly expense to cost of services and products. As a result, we recognized $3.2 million in cost of services and
products to use the spectrum licenses. SG&A expenses are down as we are aggressively identifying opportunities to minimize costs as we wind down
operations. Restructuring charges of $16.3 million were incurred in 2014 and relate to $13.1 million for contract termination fees and $3.2 million for
employee severance charges. Wireless also incurred $3.2 million in transaction costs related to the agreements. Additional one-time charges related to
shutting down operations are expected to range between $5 and $10 million and will be reported when incurred.
The increase in depreciation and amortization expense is the result of reducing the useful life of our long-lived assets in conjunction with the agreement to
sell our wireless spectrum licenses and certain other assets. The combined changes in the estimated useful life of the remaining property, plant and equipment
resulted in increased depreciation expense of $62.2 million for 2014 compared to 2013.
Asset impairment charges of $7.5 million incurred in 2014 were related to the write-off of certain construction-in-progress projects that will no longer be
completed due to the wind down of the business.
The amortization of the deferred gain recorded in 2014 totaled $22.9 million compared to $3.3 million recorded in 2013. The changes in the useful life of our
long-lived wireless assets, excluding the spectrum licenses, resulted in the acceleration of the amortization of the deferred gain in 2014. In December 2009,
the Company sold 196 wireless towers for $99.9 million in cash proceeds, and leased back a portion of the space on these towers for a term of 20 years, which
resulted in a deferred gain of $35.1 million.
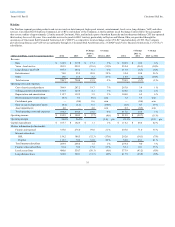
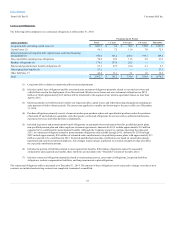
Postpaid service revenue was $139.1 million in 2013, a decrease of $35.5 million, or 20%, compared to the prior year. The decrease in postpaid service
revenue was driven by a 21% decrease in postpaid subscribers due to continued intense competitive pressure from larger national carriers. Total postpaid
ARPU for 2013 increased to $51.90 from $51.29 in 2012 driven primarily by higher data ARPU, but partially offset by a 5% year-over-year decrease in voice
ARPU due to fewer minutes used by postpaid subscribers.
At December 31, 2013, the Company had 96,000 postpaid smartphone subscribers, which represents 49% of the total postpaid subscriber base, up from 40%
at the end of 2012. The higher smartphone penetration drove a data ARPU of $19.48 for 2013, up 14% compared to 2012.
Prepaid service revenue was $45.8 million in 2013, a decrease of $4.1 million compared to the prior year. The number of prepaid subscribers at December 31,
2013 was 142,300, a decrease of 3% compared to the prior year. During 2013, data usage was lower by $1.4 million and voice usage was lower by $2.7
million resulting in a prepaid ARPU of $26.08, down 8% compared to 2012.
Equipment and other revenue for 2013 decreased by $0.7 million to $16.6 million in 2013 primarily as a result of the continued postpaid subscriber losses
which drove fewer activations and upgrades in 2013.
Cost of services and products consists largely of network operation costs, interconnection expenses with other telecommunications providers, roaming
expense (which is incurred for subscribers to use their handsets in the territories of other wireless service providers), and cost of handsets and accessories sold.
The total cost of services and products was $101.4 million in 2013, a decrease of $13.9 million compared to 2012. This decrease was primarily due to $7.9
million of lower network related costs resulting from reduced roaming rates due to reduced minutes of use and lower network access expenses as a result of
fewer subscribers. Cost of goods sold decreased by $2.1 million over the prior year, driven largely by the impact of fewer sales of wireless handsets and
related accessories. Operating taxes decreased $2.1 million due to lower voice revenues and reduced rates. Handset subsidies decreased $1.0 million
compared to the prior year due to fewer smartphone sales.
SG&A expense in 2013 decreased by $3.4 million year-over-year to $40.3 million. Cost containment efforts led to a $3.6 million reduction in payroll,
advertising, and sales and marketing costs.
42