Cincinnati Bell 2014 Annual Report Download - page 104
Download and view the complete annual report
Please find page 104 of the 2014 Cincinnati Bell annual report below. You can navigate through the pages in the report by either clicking on the pages listed below, or by using the keyword search tool below to find specific information within the annual report.-
 1
1 -
2
-
3
-
4
-
5
-
6
-
7
-
8
-
9
-
10
-
11
-
12
-
13
-
14
-
15
-
16
-
17
-
18
-
19
-
20
-
21
-
22
-
23
-
24
-
25
-
26
-
27
-
28
-
29
-
30
-
31
-
32
-
33
-
34
-
35
-
36
-
37
-
38
-
39
-
40
-
41
-
42
-
43
-
44
-
45
-
46
-
47
-
48
-
49
-
50
-
51
-
52
-
53
-
54
-
55
-
56
-
57
-
58
-
59
-
60
-
61
-
62
-
63
-
64
-
65
-
66
-
67
-
68
-
69
-
70
-
71
-
72
-
73
-
74
-
75
-
76
-
77
-
78
-
79
-
80
-
81
-
82
-
83
-
84
-
85
-
86
-
87
-
88
-
89
-
90
-
91
-
92
-
93
-
 94
94 -
 95
95 -
 96
96 -
 97
97 -
 98
98 -
 99
99 -
 100
100 -
 101
101 -
 102
102 -
 103
103 -
 104
104 -
 105
105 -
 106
106 -
 107
107 -
 108
108 -
 109
109 -
 110
110 -
 111
111 -
 112
112 -
 113
113 -
 114
114 -
115
-
116
-
117
-
118
-
119
-
120
-
121
-
122
-
123
-
124
-
125
-
126
-
127
-
128
-
129
-
130
-
131
-
132
-
133
-
134
-
135
-
136
-
137
-
138
-
139
-
140
-
141
-
142
-
143
-
144
-
145
-
146
-
147
-
148
-
149
-
150
-
151
-
152
-
153
-
154
-
155
-
156
-
157
-
158
-
159
-
160
-
161
-
162
-
163
-
164
-
165
-
166
-
167
-
168
-
169
-
170
-
171
-
172
-
173
-
174
-
175
-
176
-
177
-
178
-
179
-
180
-
181
-
182
-
183
-
184
-
185
-
186
-
187
-
188
-
189
-
190
-
191
-
192
-
193
 |
 |

Table of Contents
Form 10-K Part II
Cincinnati Bell Inc.
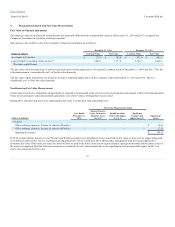
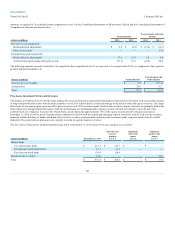
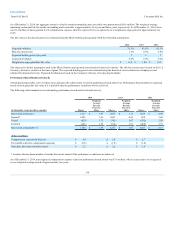
Amounts recognized in "Accumulated other comprehensive loss" on the Consolidated Statements of Shareowners’ Deficit and the Consolidated Statements of
Comprehensive Income are shown below:
Prior service cost recognized:
Reclassification adjustments $ 0.2
$ (0.4)
$ (15.4)
$ (14.1)
Prior service credit —
—
—
17.4
Actuarial (loss) gain recognized:
Reclassification adjustments 17.3
22.0
5.4
5.6
Actuarial (loss) gain arising during the period (57.5)
67.5
(12.9)
20.0
The following amounts currently included in "Accumulated other comprehensive loss" are expected to be recognized in 2015 as a component of net periodic
pension and postretirement cost:
Prior service cost (benefit) $ 0.2
$ (15.4)
Actuarial loss 20.9
6.2
Total $ 21.1
$ (9.2)
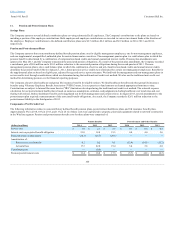
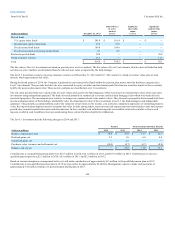
The primary investment objective for the trusts holding the assets of the pension and postretirement plans is preservation of capital with a reasonable amount
of long-term growth and income without undue exposure to risk. This is provided by a balanced strategy using fixed income and equity securities. The target
allocations for the pension plan assets are 65% equity securities and 35% investment grade fixed income securities. Equity securities are primarily held in the
form of passively managed funds that seek to track the performance of a benchmark index. Equity securities include investments in growth and value
common stocks of companies located in the United States, which represents approximately 78% of the equity securities held by the pension plans at
December 31, 2014 as well as stock of international companies located in both developed and emerging markets around the world. Fixed income securities
primarily include holdings of funds, which generally invest in a variety of intermediate and long-term investment grade corporate bonds from diversified
industries. The postretirement plan assets are currently invested in a group insurance contract.
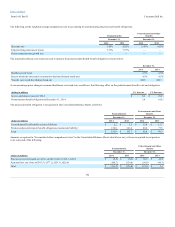
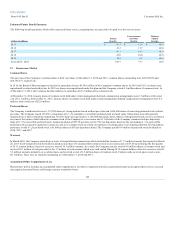
The fair values of the pension and postretirement plan assets at December 31, 2014 and 2013 by asset category are as follows:
Mutual funds
U.S. equity index funds $ 212.3
$ 212.3
$ —
$ —
International equity index funds 61.1
61.1
—
—
Fixed income bond funds 150.9
150.9
—
—
Group insurance contract 11.0
—
—
11.0
Total $ 435.3
$ 424.3
$ —
$ 11.0
103