Cincinnati Bell 2014 Annual Report Download - page 105
Download and view the complete annual report
Please find page 105 of the 2014 Cincinnati Bell annual report below. You can navigate through the pages in the report by either clicking on the pages listed below, or by using the keyword search tool below to find specific information within the annual report.-
 1
1 -
2
-
3
-
4
-
5
-
6
-
7
-
8
-
9
-
10
-
11
-
12
-
13
-
14
-
15
-
16
-
17
-
18
-
19
-
20
-
21
-
22
-
23
-
24
-
25
-
26
-
27
-
28
-
29
-
30
-
31
-
32
-
33
-
34
-
35
-
36
-
37
-
38
-
39
-
40
-
41
-
42
-
43
-
44
-
45
-
46
-
47
-
48
-
49
-
50
-
51
-
52
-
53
-
54
-
55
-
56
-
57
-
58
-
59
-
60
-
61
-
62
-
63
-
64
-
65
-
66
-
67
-
68
-
69
-
70
-
71
-
72
-
73
-
74
-
75
-
76
-
77
-
78
-
79
-
80
-
81
-
82
-
83
-
84
-
85
-
86
-
87
-
88
-
89
-
90
-
91
-
92
-
93
-
94
-
 95
95 -
 96
96 -
 97
97 -
 98
98 -
 99
99 -
 100
100 -
 101
101 -
 102
102 -
 103
103 -
 104
104 -
 105
105 -
 106
106 -
 107
107 -
 108
108 -
 109
109 -
 110
110 -
 111
111 -
 112
112 -
 113
113 -
 114
114 -
 115
115 -
116
-
117
-
118
-
119
-
120
-
121
-
122
-
123
-
124
-
125
-
126
-
127
-
128
-
129
-
130
-
131
-
132
-
133
-
134
-
135
-
136
-
137
-
138
-
139
-
140
-
141
-
142
-
143
-
144
-
145
-
146
-
147
-
148
-
149
-
150
-
151
-
152
-
153
-
154
-
155
-
156
-
157
-
158
-
159
-
160
-
161
-
162
-
163
-
164
-
165
-
166
-
167
-
168
-
169
-
170
-
171
-
172
-
173
-
174
-
175
-
176
-
177
-
178
-
179
-
180
-
181
-
182
-
183
-
184
-
185
-
186
-
187
-
188
-
189
-
190
-
191
-
192
-
193
 |
 |

Table of Contents
Form 10-K Part II
Cincinnati Bell Inc.
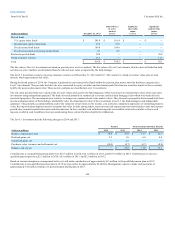
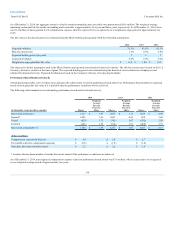
Mutual funds
U.S. equity index funds
$ 201.4
$ 201.4
$ —
$ —
International equity index funds
57.0
57.0
—
—
Fixed income bond funds
109.8
109.8
—
—
Fixed income short-term money market funds
0.3
0.3
—
—
Real estate pooled funds
30.8
—
—
30.8
Group insurance contract
11.3
—
—
11.3
Total
$ 410.6
$ 368.5
$ —
$ 42.1
The fair values of Level 1 investments are based on quoted prices in active markets. The fair values of Level 2 investments, which consist of funds that hold
securities in active markets, are determined based on the net asset value as reported by the fund manager.
The Level 3 investment consists of a group insurance contract as of December 31, 2014 and 2013. The contract is valued at contract value plus accrued
interest, which approximates fair value.
During the fourth quarter of 2014, the Company liquidated the real estate pooled funds within the pension plan master trust that had been categorized as
Level 3 investments. The proceeds from the sale were reinvested in equity securities and investment grade fixed income securities similar to those currently
held by the pension plan master trust. These new investments are classified as Level 1 investments.
The real estate pooled funds were valued at the net asset values disclosed by the fund managers, which were based on estimated fair values of the real estate
investments using independent appraisal. The funds invested primarily in commercial real estate and included mortgage loans which were backed by the
associated properties. The investments were sensitive to changes in commercial real estate market values. They focused on properties that returned both lease
income and appreciation of the buildings’ marketable value. In estimating fair value of the investments in level 3, the fund managers used independent
appraisers. The generally accepted methods used in the valuation of real estate are the income, cost, and sales comparison approaches of estimating property
value. Key inputs and assumptions used to determine fair value include among others, rental revenue and expense amounts and related revenue and expense
growth rates, terminal capitalization rates and discount rates. In the event that total withdrawal requests exceeded the total cash available to honor such
requests, available cash would have been pro-rated among those contract-holders eligible for withdrawals.
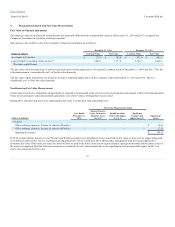
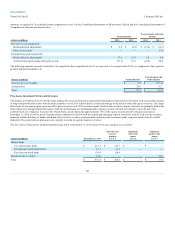
The Level 3 investments had the following changes in 2014 and 2013:
Balance, beginning of year $ 30.8
$ 27.8
$ 11.3
$ 11.7
Realized gains, net 3.2
1.0
0.4
0.4
Unrealized gains, net —
2.7
—
—
Purchases, sales, issuances and settlements, net (34.0)
(0.7)
(0.7)
(0.8)
Balance, end of year $ —
$ 30.8
$ 11.0
$ 11.3
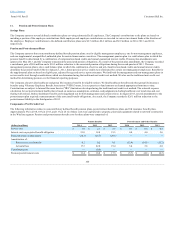
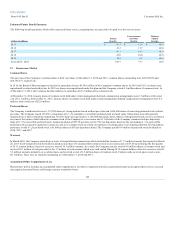
Contributions to our qualified pension plans were $19.7 million in 2014, $42.1 million in 2013, and $23.9 million in 2012. Contributions to our non-
qualified pension plan were $2.3 million in 2014, $2.9 million in 2013, and $2.0 million in 2012.
Based on current assumptions, management believes it will make contributions of approximately $13 million to the qualified pension plan in 2015.
Contributions to non-qualified pension plans in 2015 are expected to be approximately $2 million. Management expects to make cash payments of
approximately $12 million related to its postretirement health plans in 2015.
104