Cincinnati Bell 2014 Annual Report Download - page 37
Download and view the complete annual report
Please find page 37 of the 2014 Cincinnati Bell annual report below. You can navigate through the pages in the report by either clicking on the pages listed below, or by using the keyword search tool below to find specific information within the annual report.
Table of Contents
Form 10-K Part II
Cincinnati Bell Inc.
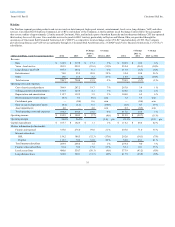
Restructuring reversal of $0.5 million in 2014 relates to a lease abandonment reserve for vacant floors totaling $1.4 million that were reoccupied offset by
severance charges recorded for outsourcing certain functions of our IT department. Restructuring charges in 2013 totaled $9.1 million including employee
separation costs of $4.6 million, lease abandonment charges of $3.9 million and contract termination charges of $0.6 million.
Asset impairments of $4.6 million in 2014 relate to the abandonment of an internal use software project that was written off in the fourth quarter. No such
impairments occurred in 2013.
Capital expenditures are incurred to expand our Fioptics product suite, upgrade and increase capacity for our internet and data networks, and to maintain our
wireline network. Capital expenditures totaled $163.7 million in 2014, an increase of $1.1 million compared to 2013. We invested $93.1 million in Fioptics,
including $50.0 million for construction to pass 59,000 addresses, $24.3 million for installation costs and $18.8 million in other Fioptics projects primarily
to increase core network capacity. As of December 31, 2014, the Company is able to provide Fioptics services to 335,000 residential and business addresses,
an increase of 21% compared to 2013.
Data revenue was $317.8 million in 2013, up $10.9 million compared to 2012. Strategic data revenue was $122.1 million in 2013, up 24% compared to the
prior year. Revenue from Fioptics high-speed internet service increased to $27.9 million in 2013, up from $18.1 million in the prior year due to a 41%
increase in subscribers. The remaining increase is primarily due to increases in strategic data for business customers which was up 17% year-over-year and
totaled $94.2 million in 2013. Legacy data revenue was $195.7 million in 2013, down $12.5 million compared to the prior year. This is primarily due to our
business customers migrating to higher bandwidth data transport products and a 7% decrease in our legacy DSL subscriber base.
Voice local service revenue was $229.1 million in 2013, down $26.3 million compared to 2012. Strategic voice service revenue was $17.9 million in 2013,
up $4.3 million compared to 2012, primarily due to the 31% growth in Fioptics voice lines, which totaled 53,300 at December 31, 2013. Legacy voice
service revenue was $204.2 million in 2013, down $29.9 million compared to 2012. The decrease in revenue is primarily due to fewer local access lines
compared to a year ago. Access lines within the segment’s ILEC territory decreased by 35,000, or 7%, to 476,000 at December 31, 2013 from 511,000 at
December 31, 2012. The Company had 54,700 CLEC access lines at December 31, 2013 compared to 62,900 access lines at December 31, 2012. The segment
continues to lose access lines as a result of, among other factors, customers electing to solely use wireless service in lieu of traditional local wireline service,
Company-initiated disconnections of customers with credit problems, and customers electing to use service from other providers. The remaining decrease is
due to a $0.7 million reduction in integration voice service revenue in 2013 compared to 2012.
Long distance and VoIP revenue was $107.2 million in 2013, a decrease of $6.7 million compared to 2012. Strategic revenue was $51.1 million in 2013,
relatively flat compared to the prior year. Growth in private-line and VoIP services totaled $2.1 million, but was more than offset by a decrease in audio
conferencing revenue primarily as a result of the loss of one large customer. Legacy revenue was $52.1 million in 2013, a decrease of $5.0 million compared
to 2012 primarily due to a 6% decrease in long distance lines as both consumers and business customers are migrating to VoIP or wireless services. The
remaining decrease is due to a $1.2 million decrease in integration services compared to the prior year.
Entertainment revenue was $55.2 million in 2013, up $19.8 million compared to the prior year and was driven by the growth in Fioptics. Fioptics
entertainment revenue grew by $19.4 million in 2013, primarily due to a 35% increase in Fioptics entertainment subscribers. As of December 31, 2013, the
segment had 74,200 Fioptics entertainment subscribers.
Other revenue was $15.5 million in 2013, a decrease of $3.4 million compared to the prior year. This decrease was primarily the result of a reduction of $2.3
million and $0.8 million in legacy and integration other revenue compared to 2012.
37


