Cincinnati Bell 2014 Annual Report Download - page 27
Download and view the complete annual report
Please find page 27 of the 2014 Cincinnati Bell annual report below. You can navigate through the pages in the report by either clicking on the pages listed below, or by using the keyword search tool below to find specific information within the annual report.-
 1
1 -
2
-
3
-
4
-
5
-
6
-
7
-
8
-
9
-
10
-
11
-
12
-
13
-
14
-
15
-
16
-
 17
17 -
 18
18 -
 19
19 -
 20
20 -
 21
21 -
 22
22 -
 23
23 -
 24
24 -
 25
25 -
 26
26 -
 27
27 -
 28
28 -
 29
29 -
 30
30 -
 31
31 -
 32
32 -
 33
33 -
 34
34 -
 35
35 -
 36
36 -
 37
37 -
38
-
39
-
40
-
41
-
42
-
43
-
44
-
45
-
46
-
47
-
48
-
49
-
50
-
51
-
52
-
53
-
54
-
55
-
56
-
57
-
58
-
59
-
60
-
61
-
62
-
63
-
64
-
65
-
66
-
67
-
68
-
69
-
70
-
71
-
72
-
73
-
74
-
75
-
76
-
77
-
78
-
79
-
80
-
81
-
82
-
83
-
84
-
85
-
86
-
87
-
88
-
89
-
90
-
91
-
92
-
93
-
94
-
95
-
96
-
97
-
98
-
99
-
100
-
101
-
102
-
103
-
104
-
105
-
106
-
107
-
108
-
109
-
110
-
111
-
112
-
113
-
114
-
115
-
116
-
117
-
118
-
119
-
120
-
121
-
122
-
123
-
124
-
125
-
126
-
127
-
128
-
129
-
130
-
131
-
132
-
133
-
134
-
135
-
136
-
137
-
138
-
139
-
140
-
141
-
142
-
143
-
144
-
145
-
146
-
147
-
148
-
149
-
150
-
151
-
152
-
153
-
154
-
155
-
156
-
157
-
158
-
159
-
160
-
161
-
162
-
163
-
164
-
165
-
166
-
167
-
168
-
169
-
170
-
171
-
172
-
173
-
174
-
175
-
176
-
177
-
178
-
179
-
180
-
181
-
182
-
183
-
184
-
185
-
186
-
187
-
188
-
189
-
190
-
191
-
192
-
193
 |
 |

Table of Contents
Form 10-K Part II
Cincinnati Bell Inc.
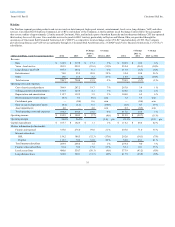
The selected financial data should be read in conjunction with the consolidated financial statements and "Management’s Discussion and Analysis of
Financial Condition and Results of Operations" included in this document.
Revenue
$ 1,278.2
$ 1,256.9
$ 1,473.9
$ 1,462.4
$ 1,377.0
Cost of services and products, selling, general and administrative,
depreciation, and amortization expense
1,153.2
1,033.4
1,181.5
1,139.9
1,054.9
Other operating costs and losses (c)
9.2
59.7
22.3
63.0
22.8
Operating income
115.8
163.8
270.1
259.5
299.3
Interest expense
148.7
182.0
218.9
215.0
185.2
Loss on extinguishment of debt
19.6
29.6
13.6
—
46.5
Loss from CyrusOne equity method investment (d)
7.0
10.7
—
—
—
Gain on sale of CyrusOne equity method investment (e)
(192.8)
—
—
—
—
Net income (loss)
$ 75.6
$ (54.7)
$ 11.2
$ 18.6
$ 28.3
Basic and diluted earnings (loss) per common share
$ 0.31
$ (0.32)
$ 0.00
$ 0.04
$ 0.09
Dividends declared per common share
$ —
$ —
$ —
$ —
$ —
Weighted-average common shares outstanding
Basic
208.5
205.9
197.0
196.8
201.0
Diluted
209.6
205.9
204.7
200.0
204.0
Property, plant and equipment, net
$ 859.5
$ 902.8
$ 1,587.4
$ 1,400.5
$ 1,264.4
Total assets
1,819.7
2,107.3
2,872.4
2,714.7
2,653.6
Total long-term obligations (f)
2,058.4
2,529.7
3,215.2
3,073.5
2,992.7
Cash flow provided by operating activities
$ 175.2
$ 78.8
$ 212.7
$ 289.9
$ 300.0
Cash flow provided by (used in) investing activities (g)
392.6
(185.4)
(371.8)
(244.7)
(675.5)
Cash flow (used in) provided by financing activities (h)
(514.5)
87.6
109.0
(48.8)
429.8
Capital expenditures
(182.3)
(196.9)
(367.2)
(255.5)
(149.7)
27