Cincinnati Bell 2014 Annual Report Download - page 121
Download and view the complete annual report
Please find page 121 of the 2014 Cincinnati Bell annual report below. You can navigate through the pages in the report by either clicking on the pages listed below, or by using the keyword search tool below to find specific information within the annual report.-
 1
1 -
2
-
3
-
4
-
5
-
6
-
7
-
8
-
9
-
10
-
11
-
12
-
13
-
14
-
15
-
16
-
17
-
18
-
19
-
20
-
21
-
22
-
23
-
24
-
25
-
26
-
27
-
28
-
29
-
30
-
31
-
32
-
33
-
34
-
35
-
36
-
37
-
38
-
39
-
40
-
41
-
42
-
43
-
44
-
45
-
46
-
47
-
48
-
49
-
50
-
51
-
52
-
53
-
54
-
55
-
56
-
57
-
58
-
59
-
60
-
61
-
62
-
63
-
64
-
65
-
66
-
67
-
68
-
69
-
70
-
71
-
72
-
73
-
74
-
75
-
76
-
77
-
78
-
79
-
80
-
81
-
82
-
83
-
84
-
85
-
86
-
87
-
88
-
89
-
90
-
91
-
92
-
93
-
94
-
95
-
96
-
97
-
98
-
99
-
100
-
101
-
102
-
103
-
104
-
105
-
106
-
107
-
108
-
109
-
110
-
 111
111 -
 112
112 -
 113
113 -
 114
114 -
 115
115 -
 116
116 -
 117
117 -
 118
118 -
 119
119 -
 120
120 -
 121
121 -
 122
122 -
 123
123 -
 124
124 -
 125
125 -
 126
126 -
 127
127 -
 128
128 -
 129
129 -
 130
130 -
 131
131 -
132
-
133
-
134
-
135
-
136
-
137
-
138
-
139
-
140
-
141
-
142
-
143
-
144
-
145
-
146
-
147
-
148
-
149
-
150
-
151
-
152
-
153
-
154
-
155
-
156
-
157
-
158
-
159
-
160
-
161
-
162
-
163
-
164
-
165
-
166
-
167
-
168
-
169
-
170
-
171
-
172
-
173
-
174
-
175
-
176
-
177
-
178
-
179
-
180
-
181
-
182
-
183
-
184
-
185
-
186
-
187
-
188
-
189
-
190
-
191
-
192
-
193
 |
 |

Table of Contents
Form 10-K Part II
Cincinnati Bell Inc.
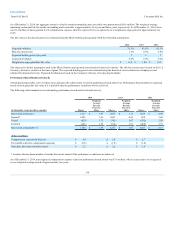
Cash flows (used in) provided by operating activities $ (56.3)
$ 228.7
$ 2.8
$ —
$ 175.2
Capital expenditures (0.2)
(152.5)
(29.6)
—
(182.3)
Proceeds received from sale of CyrusOne —
—
355.9
—
355.9
Dividends received from CyrusOne —
—
28.4
—
28.4
Proceeds from sale of assets —
0.3
196.1
—
196.4
Distributions received from subsidiaries 12.8
—
—
(12.8)
—
Funding between Parent and subsidiaries, net —
(73.4)
(542.6)
616.0
—
Other investing activities (0.3)
—
(5.5)
—
(5.8)
Cash flows provided by (used in) investing activities 12.3
(225.6)
2.7
603.2
392.6
Funding between Parent and subsidiaries, net 516.2
—
99.8
(616.0)
—
Distributions paid to Parent —
—
(12.8)
12.8
—
Debt issuance costs (0.7)
—
(0.2)
—
(0.9)
Net decrease in corporate credit and receivables facilities with
initial maturities less than 90 days (40.0)
—
(87.0)
—
(127.0)
Repayment of debt (367.3)
(3.9)
(5.3)
—
(376.5)
Proceeds from exercise of options and warrants 1.3
—
—
—
1.3
Other financing activities (11.4)
—
—
—
(11.4)
Cash flows provided by (used in) financing activities 98.1
(3.9)
(5.5)
(603.2)
(514.5)
Increase (decrease) in cash and cash equivalents 54.1
(0.8)
—
—
53.3
Beginning cash and cash equivalents 2.1
1.8
0.7
—
4.6
Ending cash and cash equivalents $ 56.2
$ 1.0
$ 0.7
$ —
$ 57.9
Cash flows (used in) provided by operating activities $ (218.1)
$ 239.0
$ 57.9
$ —
$ 78.8
Capital expenditures —
(153.1)
(43.8)
—
(196.9)
Dividends received from CyrusOne —
—
21.3
—
21.3
Proceeds from sale of assets —
2.0
—
—
2.0
Cash divested from deconsolidation of CyrusOne —
—
(12.2)
—
(12.2)
Other investing activities —
—
0.4
—
0.4
Cash flows used in investing activities —
(151.1)
(34.3)
—
(185.4)
Issuance of long-term debt 536.0
—
—
—
536.0
Funding between Parent and subsidiaries, net 174.2
(84.3)
(89.9)
—
—
Debt issuance costs (6.7)
—
—
—
(6.7)
Net increase in corporate credit and receivables facilities with
initial maturities less than 90 days 40.0
—
54.2
—
94.2
Repayment of debt (522.0)
(3.7)
(5.1)
—
(530.8)
Proceeds from exercise of options and warrants 7.1
—
—
—
7.1
Other financing activities (12.2)
—
—
—
(12.2)
Cash flows provided by (used in) financing activities 216.4
(88.0)
(40.8)
—
87.6
Decrease in cash and cash equivalents (1.7)
(0.1)
(17.2)
—
(19.0)
Beginning cash and cash equivalents 3.8
1.9
17.9
—
23.6
Ending cash and cash equivalents $ 2.1
$ 1.8
$ 0.7
$ —
$ 4.6
120