Cincinnati Bell 2014 Annual Report Download - page 100
Download and view the complete annual report
Please find page 100 of the 2014 Cincinnati Bell annual report below. You can navigate through the pages in the report by either clicking on the pages listed below, or by using the keyword search tool below to find specific information within the annual report.-
 1
1 -
2
-
3
-
4
-
5
-
6
-
7
-
8
-
9
-
10
-
11
-
12
-
13
-
14
-
15
-
16
-
17
-
18
-
19
-
20
-
21
-
22
-
23
-
24
-
25
-
26
-
27
-
28
-
29
-
30
-
31
-
32
-
33
-
34
-
35
-
36
-
37
-
38
-
39
-
40
-
41
-
42
-
43
-
44
-
45
-
46
-
47
-
48
-
49
-
50
-
51
-
52
-
53
-
54
-
55
-
56
-
57
-
58
-
59
-
60
-
61
-
62
-
63
-
64
-
65
-
66
-
67
-
68
-
69
-
70
-
71
-
72
-
73
-
74
-
75
-
76
-
77
-
78
-
79
-
80
-
81
-
82
-
83
-
84
-
85
-
86
-
87
-
88
-
89
-
 90
90 -
 91
91 -
 92
92 -
 93
93 -
 94
94 -
 95
95 -
 96
96 -
 97
97 -
 98
98 -
 99
99 -
 100
100 -
 101
101 -
 102
102 -
 103
103 -
 104
104 -
 105
105 -
 106
106 -
 107
107 -
 108
108 -
 109
109 -
 110
110 -
111
-
112
-
113
-
114
-
115
-
116
-
117
-
118
-
119
-
120
-
121
-
122
-
123
-
124
-
125
-
126
-
127
-
128
-
129
-
130
-
131
-
132
-
133
-
134
-
135
-
136
-
137
-
138
-
139
-
140
-
141
-
142
-
143
-
144
-
145
-
146
-
147
-
148
-
149
-
150
-
151
-
152
-
153
-
154
-
155
-
156
-
157
-
158
-
159
-
160
-
161
-
162
-
163
-
164
-
165
-
166
-
167
-
168
-
169
-
170
-
171
-
172
-
173
-
174
-
175
-
176
-
177
-
178
-
179
-
180
-
181
-
182
-
183
-
184
-
185
-
186
-
187
-
188
-
189
-
190
-
191
-
192
-
193
 |
 |

Table of Contents
Form 10-K Part II
Cincinnati Bell Inc.
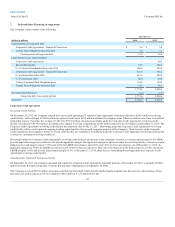
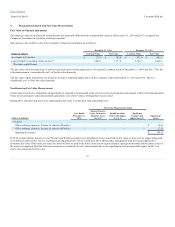
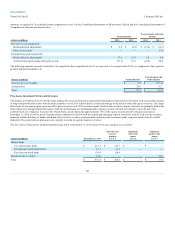
Restructuring liabilities have been established for employee separations, lease abandonment and contract terminations. A summary of activity in the
restructuring liability is shown below:
Balance as of December 31, 2011 $ 14.2
$ 8.1
$ 1.7
$ 24.0
Charges 2.5
0.9
—
3.4
Utilizations (8.9)
(3.5)
(1.5)
(13.9)
Balance as of December 31, 2012 $ 7.8
$ 5.5
$ 0.2
$ 13.5
Charges 9.0
4.1
0.6
13.7
Utilizations (7.1)
(3.6)
(0.7)
(11.4)
Balance as of December 31, 2013 $ 9.7
$ 6.0
$ 0.1
$ 15.8
Charges/(Reversals) 4.2
(1.4)
13.1
15.9
Utilizations (8.0)
(2.7)
(0.7)
(11.4)
Balance as of December 31, 2014 $ 5.9
$ 1.9
$ 12.5
$ 20.3
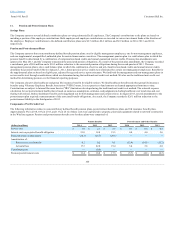
Employee separation costs consist of severance to be paid pursuant to the Company's written severance plan. In 2014, employee separation costs included
charges attributable to outsourcing a portion of our IT function, charges for the wind down of our Wireless business as well as consulting fees related to a
workforce optimization initiative. During 2013, employee separation costs also included consulting fees related to a workforce optimization initiative. A
voluntary termination program was offered in 2012 to certain Wireline call center employees and included in employee separation costs. Severance payments
are expected to be paid through 2015.
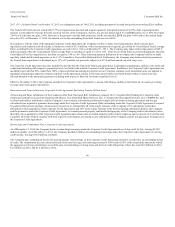
Lease abandonment costs represent future minimum lease obligations, net of expected sublease income, for abandoned facilities. Reversals in 2014 were
related to leased space that was previously reserved that was reoccupied in the third quarter. Lease payments on abandoned facilities will continue through
2015.
In 2014, contract terminations consisted of wireless contracts that will no longer be utilized once the wireless business ceases operations. Additional
restructuring charges associated with the shutdown of our wireless operations will be recognized once the accounting criteria are achieved. For 2013, contract
terminations consisted of amounts due to a distributor to terminate a contractual agreement. Contract terminations are expected to be paid out through 2015.
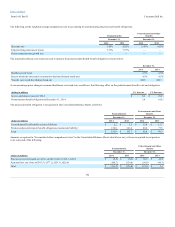
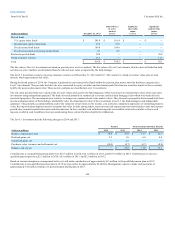
A summary of restructuring activity by business segment is presented below:
Balance as of December 31, 2011 $ 15.1
$ 2.5
$ 0.7
$ —
$ 5.7
$ 24.0
Charges 3.5
(1.2)
1.6
0.5
(1.0)
3.4
Utilizations (10.0)
(0.8)
(0.7)
(0.5)
(1.9)
(13.9)
Balance as of December 31, 2012 $ 8.6
$ 0.5
$ 1.6
$ —
$ 2.8
$ 13.5
Charges 9.1
0.7
0.2
—
3.7
13.7
Utilizations (7.2)
(0.4)
(0.3)
—
(3.5)
(11.4)
Balance as of December 31, 2013 $ 10.5
$ 0.8
$ 1.5
$ —
$ 3.0
$ 15.8
Charges/(Reversals) (0.5)
—
16.3
—
0.1
15.9
Utilizations (6.1)
(0.5)
(2.4)
—
(2.4)
(11.4)
Balance as of December 31, 2014 $ 3.9
$ 0.3
$ 15.4
$ —
$ 0.7
$ 20.3
At December 31, 2014 and 2013, $20.3 million and $7.8 million, respectively, of the restructuring liabilities were included in “Other current liabilities.” At
December 31, 2013, $8.0 million was included in "Other noncurrent liabilities."
99