Cincinnati Bell 2014 Annual Report Download - page 39
Download and view the complete annual report
Please find page 39 of the 2014 Cincinnati Bell annual report below. You can navigate through the pages in the report by either clicking on the pages listed below, or by using the keyword search tool below to find specific information within the annual report.-
 1
1 -
2
-
3
-
4
-
5
-
6
-
7
-
8
-
9
-
10
-
11
-
12
-
13
-
14
-
15
-
16
-
17
-
18
-
19
-
20
-
21
-
22
-
23
-
24
-
25
-
26
-
27
-
28
-
 29
29 -
 30
30 -
 31
31 -
 32
32 -
 33
33 -
 34
34 -
 35
35 -
 36
36 -
 37
37 -
 38
38 -
 39
39 -
 40
40 -
 41
41 -
 42
42 -
 43
43 -
 44
44 -
 45
45 -
 46
46 -
 47
47 -
 48
48 -
 49
49 -
50
-
51
-
52
-
53
-
54
-
55
-
56
-
57
-
58
-
59
-
60
-
61
-
62
-
63
-
64
-
65
-
66
-
67
-
68
-
69
-
70
-
71
-
72
-
73
-
74
-
75
-
76
-
77
-
78
-
79
-
80
-
81
-
82
-
83
-
84
-
85
-
86
-
87
-
88
-
89
-
90
-
91
-
92
-
93
-
94
-
95
-
96
-
97
-
98
-
99
-
100
-
101
-
102
-
103
-
104
-
105
-
106
-
107
-
108
-
109
-
110
-
111
-
112
-
113
-
114
-
115
-
116
-
117
-
118
-
119
-
120
-
121
-
122
-
123
-
124
-
125
-
126
-
127
-
128
-
129
-
130
-
131
-
132
-
133
-
134
-
135
-
136
-
137
-
138
-
139
-
140
-
141
-
142
-
143
-
144
-
145
-
146
-
147
-
148
-
149
-
150
-
151
-
152
-
153
-
154
-
155
-
156
-
157
-
158
-
159
-
160
-
161
-
162
-
163
-
164
-
165
-
166
-
167
-
168
-
169
-
170
-
171
-
172
-
173
-
174
-
175
-
176
-
177
-
178
-
179
-
180
-
181
-
182
-
183
-
184
-
185
-
186
-
187
-
188
-
189
-
190
-
191
-
192
-
193
 |
 |

Table of Contents
Form 10-K Part II
Cincinnati Bell Inc.
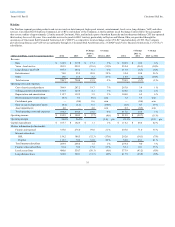
The IT Services and Hardware segment provides a full range of managed IT solutions, including managed infrastructure services, IT and telephony equipment
sales, and professional IT staffing services. These services and products are provided in multiple geographic areas including locations in the U.S., Canada and
Europe. By offering a full range of equipment and outsourced services in conjunction with the Company’s wireline network, the IT Services and Hardware
segment provides end-to-end IT and telecommunications infrastructure management designed to reduce cost and mitigate risk while optimizing performance
for its customers.
Revenue:
Telecom and IT equipment distribution $ 287.7
$ 222.6
$ 65.1
29%
$ 204.6
$ 18.0
9 %
Managed and professional services 145.3
121.5
23.8
20%
111.1
10.4
9 %
Total revenue 433.0
344.1
88.9
26%
315.7
28.4
9 %
Operating costs and expenses:
Cost of services and products 350.0
279.8
70.2
25%
255.7
24.1
9 %
Selling, general and administrative 51.5
44.6
6.9
15%
42.3
2.3
5 %
Depreciation and amortization 11.7
10.5
1.2
11%
8.6
1.9
22 %
Restructuring charges (reversals) —
0.7
(0.7)
n/m
(1.2)
1.9
n/m
Total operating costs and expenses 413.2
335.6
77.6
23%
305.4
30.2
10 %
Operating income $ 19.8
$ 8.5
$ 11.3
n/m
$ 10.3
$ (1.8)
(17)%
Operating margin 4.6%
2.5%
2.1 pts 3.3%
(0.8) pts
Capital expenditures $ 11.9
$ 10.6
$ 1.3
12%
$ 9.0
$ 1.6
18 %
Managed and professional services revenue consists of managed VoIP solutions and IT services that include network management, electronic data storage,
disaster recovery and data security management, as well as both long and short-term IT outsourcing and consulting engagements. Revenue from telecom and
IT equipment distribution represents the sale, installation, and maintenance of major, branded IT and telephony equipment.
Strategic managed and professional services revenue totaled $138.7 million in 2014, up $20.6 million compared to the prior year largely as a result of higher
demand for our managed services from the Company's largest customer. Integration services totaled $294.3 million, up from $226.0 million in 2013. The
increase is due to increased telecom and IT equipment distribution revenue reflecting the cyclical fluctuation in capital spending by our enterprise customers
which may be influenced by many factors, including the timing of customers' capital spend, the size of capital budgets and general economic conditions.
Integration managed and professional services totaled $6.6 million in 2014 compared to $3.4 million in 2013.
Cost of services and products was $350.0 million in 2014, an increase of $70.2 million compared to 2013. The increase was largely driven by a $52.6 million
increase in cost of goods sold related to higher equipment sales. Payroll and contract services costs were up $16.6 million to support the growth in managed
and professional services.
SG&A expenses were $51.5 million in 2014, an increase of $6.9 million from the prior year. Employee related and contract services costs were up $4.5
million to support the growth in strategic revenue. Commissions were up $2.2 million due to increased sales.
Depreciation and amortization expense for 2014 of $11.7 million was higher than 2013 due to an increased asset base used to support the growing managed
service business.
39