Cigna 2013 Annual Report Download - page 81
Download and view the complete annual report
Please find page 81 of the 2013 Cigna annual report below. You can navigate through the pages in the report by either clicking on the pages listed below, or by using the keyword search tool below to find specific information within the annual report.-
 1
1 -
2
-
3
-
4
-
5
-
6
-
7
-
8
-
9
-
10
-
11
-
12
-
13
-
14
-
15
-
16
-
17
-
18
-
19
-
20
-
21
-
22
-
23
-
24
-
25
-
26
-
27
-
28
-
29
-
30
-
31
-
32
-
33
-
34
-
35
-
36
-
37
-
38
-
39
-
40
-
41
-
42
-
43
-
44
-
45
-
46
-
47
-
48
-
49
-
50
-
51
-
52
-
53
-
54
-
55
-
56
-
57
-
58
-
59
-
60
-
61
-
62
-
63
-
64
-
65
-
66
-
67
-
68
-
69
-
70
-
 71
71 -
 72
72 -
 73
73 -
 74
74 -
 75
75 -
 76
76 -
 77
77 -
 78
78 -
 79
79 -
 80
80 -
 81
81 -
 82
82 -
 83
83 -
 84
84 -
 85
85 -
 86
86 -
 87
87 -
 88
88 -
 89
89 -
 90
90 -
 91
91 -
92
-
93
-
94
-
95
-
96
-
97
-
98
-
99
-
100
-
101
-
102
-
103
-
104
-
105
-
106
-
107
-
108
-
109
-
110
-
111
-
112
-
113
-
114
-
115
-
116
-
117
-
118
-
119
-
120
-
121
-
122
-
123
-
124
-
125
-
126
-
127
-
128
-
129
-
130
-
131
-
132
-
133
-
134
-
135
-
136
-
137
-
138
-
139
-
140
-
141
-
142
-
143
-
144
-
145
-
146
-
147
-
148
-
149
-
150
-
151
-
152
-
153
-
154
-
155
-
156
-
157
-
158
-
159
-
160
-
161
-
162
-
163
-
164
-
165
-
166
-
167
-
168
-
169
-
170
-
171
-
172
-
173
-
174
-
175
-
176
-
177
-
178
-
179
-
180
-
181
-
182
 |
 |

PART II
ITEM 7. Management’s Discussion and Analysis of Financial Condition and Results of Operations
Loss ratios increased in 2013 and 2012 compared with each prior year,
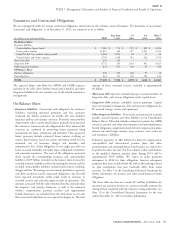
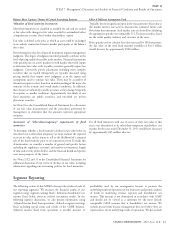
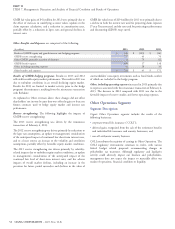
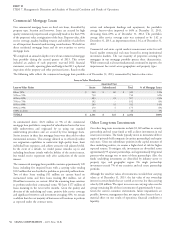
Other Items Affecting Global Supplemental Benefits
reflecting the inherently higher loss ratios of the acquisitions.
Results
Policy acquisition expenses increased in 2013 and 2012, compared For our Global Supplemental Benefits segment, South Korea is the
with the prior year, reflecting the acquisitions and business growth, single largest geographic market, generating 51% of segment revenues
partially offset by lower acquisition costs in Europe reflecting a and 87% of the segment earnings in 2013. Due to the concentration
decision to cease selling activities in certain markets during 2012. of business in South Korea, the Global Supplemental Benefits
segment is exposed to potential losses resulting from economic,
Excluding the realignment and efficiency charges from 2013 and
regulatory and geopolitical developments in that country, as well as
2012, expense ratios decreased in 2013 compared with 2012. The
foreign currency movements affecting the South Korean currency, that
decrease was primarily driven by the impact of the lower expense
could have a significant impact on the segment’s results and our
ratios associated with the Great American Supplemental Benefits
consolidated financial results. In 2013, our operations in South Korea
business, partially offset by strategically planned investment spending
represented 4% of Cigna’s total consolidated revenues and 10% of
to support future business growth. Excluding special items, expense
shareholders’ net income.
ratios increased in 2012 compared with 2011 primarily driven by the
impact of higher expense ratios associated with FirstAssist.
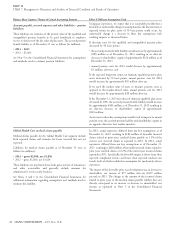
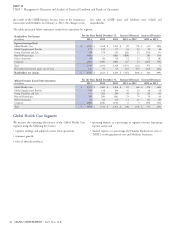
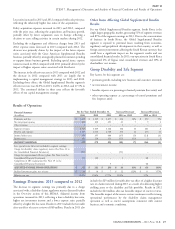
Group Disability and Life Segment
The increase in the effective tax rate in 2013 compared with 2012 and Key factors for this segment are:
the decrease in 2012 compared with 2011 are largely due to
implementing a capital management strategy in 2013 and 2012. premium growth, including new business and customer retention;
Excluding those effects, the Global Supplemental Benefits segment’s net investment income;
effective tax rate was 24.0% in 2013, 24.6% in 2012, and 27.3% in
2011. The continued decline in these rates reflects the favorable benefits expense as a percentage of earned premium (loss ratio); and
effects of our capital management strategy. other operating expense as a percentage of earned premiums and
fees (expense ratio).
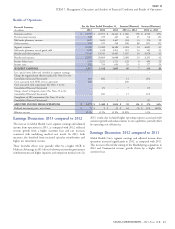
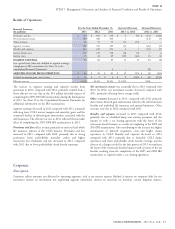
Results of Operations
For the Years Ended December 31, Increase/(Decrease) Increase/(Decrease)
Financial Summary
(In millions)
2013 2012 2011 2013 vs. 2012 2012 vs. 2011
Premiums and fees $ 3,425 $ 3,109 $ 2,857 $ 316 10% $ 252 9%
Net investment income 321 300 291 21 7 9 3
Other revenues 1 – – 1 – – –
Segment revenues 3,747 3,409 3,148 338 10 261 8
Benefits and expenses 3,387 3,014 2,740 373 12 274 10
Income before taxes 360 395 408 (35) (9) (13) (3)
Income taxes 101 116 113 (15) (13) 3 3
SEGMENT EARNINGS 259 279 295 (20) (7) (16) (5)
Less: special items (after-tax) included in segment earnings:
Charge for disability claims regulatory matter (See Note 23 to
the Consolidated Financial Statements) (51) – – (51) –
Charge for organizational efficiency plans (See Note 6 to the
Consolidated Financial Statements) (1) (2) – 1 (2)
Completion of IRS examination (See Note 19 to the
Consolidated Financial Statements) – – 5 – (5)
ADJUSTED INCOME FROM OPERATIONS $ 311 $ 281 $ 290 $ 30 11% $ (9) (3)%
Realized investment gains, net of taxes $ 40 $ 18 $ 7 $ 22 122% $ 11 157%
Effective tax rate 28.1% 29.4% 27.7% (1.3)% 1.7%
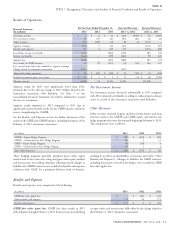
include the $29 million favorable after-tax effect of a higher discount
Earnings Discussion: 2013 compared to 2012
rate on claims incurred during 2013 as a result of reallocating higher
The decrease in segment earnings was primarily due to a charge yielding assets to the disability and life portfolio. Results in 2012
associated with a disability claims regulatory matter discussed further include the $43 million after-tax favorable impact of reserve reviews.
in the Overview section of this MD&A. Adjusted income from The favorable impact of the reserve reviews continues to reflect strong
operations increased in 2013, reflecting a lower disability loss ratio, operational performance by the disability claims management
higher net investment income and a lower expense ratio, partially operation as well as reserve assumptions consistent with current
offset by a higher life loss ratio. Results in 2013 include the favorable business and economic conditions.
after-tax effect of reserve reviews of $60 million. Results in 2013 also
CIGNA CORPORATION - 2013 Form 10-K 49
•
•
•
•