Cigna 2013 Annual Report Download - page 126
Download and view the complete annual report
Please find page 126 of the 2013 Cigna annual report below. You can navigate through the pages in the report by either clicking on the pages listed below, or by using the keyword search tool below to find specific information within the annual report.-
 1
1 -
2
-
3
-
4
-
5
-
6
-
7
-
8
-
9
-
10
-
11
-
12
-
13
-
14
-
15
-
16
-
17
-
18
-
19
-
20
-
21
-
22
-
23
-
24
-
25
-
26
-
27
-
28
-
29
-
30
-
31
-
32
-
33
-
34
-
35
-
36
-
37
-
38
-
39
-
40
-
41
-
42
-
43
-
44
-
45
-
46
-
47
-
48
-
49
-
50
-
51
-
52
-
53
-
54
-
55
-
56
-
57
-
58
-
59
-
60
-
61
-
62
-
63
-
64
-
65
-
66
-
67
-
68
-
69
-
70
-
71
-
72
-
73
-
74
-
75
-
76
-
77
-
78
-
79
-
80
-
81
-
82
-
83
-
84
-
85
-
86
-
87
-
88
-
89
-
90
-
91
-
92
-
93
-
94
-
95
-
96
-
97
-
98
-
99
-
100
-
101
-
102
-
103
-
104
-
105
-
106
-
107
-
108
-
109
-
110
-
111
-
112
-
113
-
114
-
115
-
 116
116 -
 117
117 -
 118
118 -
 119
119 -
 120
120 -
 121
121 -
 122
122 -
 123
123 -
 124
124 -
 125
125 -
 126
126 -
 127
127 -
 128
128 -
 129
129 -
 130
130 -
 131
131 -
 132
132 -
 133
133 -
 134
134 -
 135
135 -
 136
136 -
137
-
138
-
139
-
140
-
141
-
142
-
143
-
144
-
145
-
146
-
147
-
148
-
149
-
150
-
151
-
152
-
153
-
154
-
155
-
156
-
157
-
158
-
159
-
160
-
161
-
162
-
163
-
164
-
165
-
166
-
167
-
168
-
169
-
170
-
171
-
172
-
173
-
174
-
175
-
176
-
177
-
178
-
179
-
180
-
181
-
182
 |
 |

PART II
ITEM 8. Financial Statements and Supplementary Data
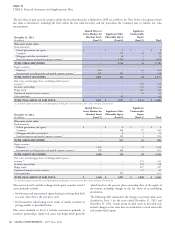
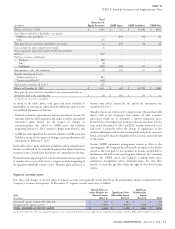
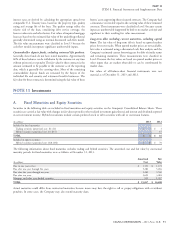
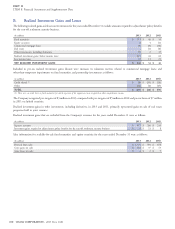
Gross unrealized appreciation (depreciation) on fixed maturities by type of issuer is shown below (excluding trading securities and hybrid
securities with a fair value of $6 million at December 31, 2013 and $16 million at December 31, 2012).
December 31, 2013
Amortized Unrealized Unrealized Fair
(In millions)
Cost Appreciation Depreciation Value
Federal government and agency $ 640 $ 242 $ (2) $ 880
State and local government 1,983 167 (6) 2,144
Foreign government 1,392 64 (12) 1,444
Corporate 10,301 749 (74) 10,976
Federal agency mortgage-backed 77 – (1) 76
Other mortgage-backed 76 3 (2) 77
Other asset-backed 798 87 (2) 883
TOTAL $ 15,267 $ 1,312 $ (99) $ 16,480
December 31, 2012
Amortized Unrealized Unrealized Fair
(In millions)
Cost Appreciation Depreciation Value
Federal government and agency $ 509 $ 393 $ – $ 902
State and local government 2,169 270 (2) 2,437
Foreign government 1,197 126 (1) 1,322
Corporate 10,590 1,308 (17) 11,881
Federal agency mortgage-backed 121 1 – 122
Other mortgage-backed 82 11 (4) 89
Other asset-backed 797 145 (6) 936
TOTAL $ 15,465 $ 2,254 $ (30) $ 17,689
The above table includes investments with a fair value of $2.6 billion Review of declines in fair value. Management reviews fixed
supporting the Company’s run-off settlement annuity business, with maturities with a decline in fair value from cost for impairment based
gross unrealized appreciation of $478 million and gross unrealized on criteria that include:
depreciation of $20 million at December 31, 2013. Such unrealized length of time and severity of decline;
amounts are required to support future policy benefit liabilities of this
business and, as such, are not included in accumulated other financial health and specific near term prospects of the issuer;
comprehensive income. At December 31, 2012, investments changes in the regulatory, economic or general market environment
supporting this business had a fair value of $3.1 billion, gross of the issuer’s industry or geographic region; and
unrealized appreciation of $883 million and gross unrealized
depreciation of $8 million. the Company’s intent to sell or the likelihood of a required sale prior
to recovery.
As of December 31, 2013, the Company had commitments to
purchase $56 million of fixed maturities, all of which bear interest at a
fixed market rate.
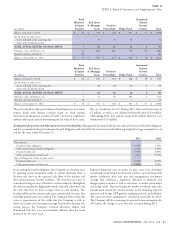
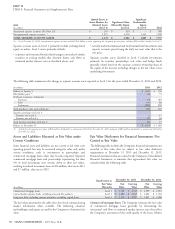
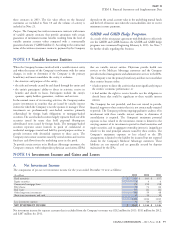
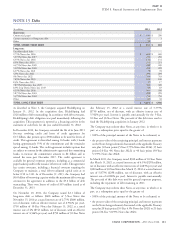
As of December 31, 2013, fixed maturities (excluding trading and hybrid securities) with a decline in fair value from amortized cost (primarily
corporate securities) were by length of time of decline, as follows:
December 31, 2013
Fair Amortized Unrealized Number
(Dollars in millions)
Value Cost Depreciation of Issues
Fixed maturities:
One year or less:
Investment grade $ 2,250 $ 2,317 $ (67) 599
Below investment grade $ 237 $ 243 $ (6) 210
More than one year:
Investment grade $ 256 $ 278 $ (22) 72
Below investment grade $ 46 $ 50 $ (4) 16
As of December 31, 2013, the unrealized depreciation of investment grade fixed maturities is primarily due to increases in market yields since
purchase. Excluding trading and hybrid securities, equity securities with a fair value lower than cost were not material at December 31, 2013.
94 CIGNA CORPORATION - 2013 Form 10-K
•
•
•
•