Cigna 2013 Annual Report Download - page 80
Download and view the complete annual report
Please find page 80 of the 2013 Cigna annual report below. You can navigate through the pages in the report by either clicking on the pages listed below, or by using the keyword search tool below to find specific information within the annual report.-
 1
1 -
2
-
3
-
4
-
5
-
6
-
7
-
8
-
9
-
10
-
11
-
12
-
13
-
14
-
15
-
16
-
17
-
18
-
19
-
20
-
21
-
22
-
23
-
24
-
25
-
26
-
27
-
28
-
29
-
30
-
31
-
32
-
33
-
34
-
35
-
36
-
37
-
38
-
39
-
40
-
41
-
42
-
43
-
44
-
45
-
46
-
47
-
48
-
49
-
50
-
51
-
52
-
53
-
54
-
55
-
56
-
57
-
58
-
59
-
60
-
61
-
62
-
63
-
64
-
65
-
66
-
67
-
68
-
69
-
 70
70 -
 71
71 -
 72
72 -
 73
73 -
 74
74 -
 75
75 -
 76
76 -
 77
77 -
 78
78 -
 79
79 -
 80
80 -
 81
81 -
 82
82 -
 83
83 -
 84
84 -
 85
85 -
 86
86 -
 87
87 -
 88
88 -
 89
89 -
 90
90 -
91
-
92
-
93
-
94
-
95
-
96
-
97
-
98
-
99
-
100
-
101
-
102
-
103
-
104
-
105
-
106
-
107
-
108
-
109
-
110
-
111
-
112
-
113
-
114
-
115
-
116
-
117
-
118
-
119
-
120
-
121
-
122
-
123
-
124
-
125
-
126
-
127
-
128
-
129
-
130
-
131
-
132
-
133
-
134
-
135
-
136
-
137
-
138
-
139
-
140
-
141
-
142
-
143
-
144
-
145
-
146
-
147
-
148
-
149
-
150
-
151
-
152
-
153
-
154
-
155
-
156
-
157
-
158
-
159
-
160
-
161
-
162
-
163
-
164
-
165
-
166
-
167
-
168
-
169
-
170
-
171
-
172
-
173
-
174
-
175
-
176
-
177
-
178
-
179
-
180
-
181
-
182
 |
 |

PART II
ITEM 7. Management’s Discussion and Analysis of Financial Condition and Results of Operations
benefits expense as a percentage of earned premium (loss ratio); currencies will decrease segment earnings, while a weakening U.S.
Dollar produces the opposite effect.
operating expense as a percentage of earned premium (expense
ratio); and As described in Note 3 to the Consolidated Financial Statements, the
Global Supplemental Benefits segment acquired two businesses
the impact of foreign currency movements. during the second half of 2012: Great American Supplemental
Benefits and Finans Emeklilik (also referred to as the ‘‘Turkey JV’’).
Throughout this discussion, prior period currency adjusted income
Collectively, throughout this discussion these two transactions are
from operations, revenues, and benefits and expenses are being
referred to as ‘‘the acquisitions’’.
calculated by applying the current period’s exchange rates to reported
results in the prior period. A strengthening U.S. Dollar against foreign
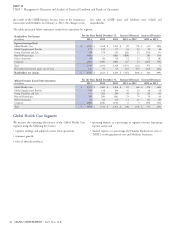
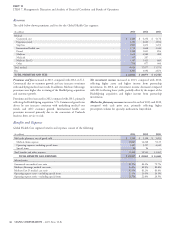
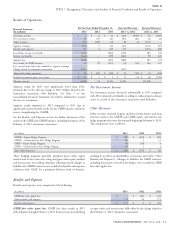
Results of Operations
For the Years Ended December 31, Increase/(Decrease) Increase/(Decrease)
Financial Summary
(In millions)
2013 2012 2011 2013 vs. 2012 2012 vs. 2011
Premiums and fees $ 2,513 $ 1,984 $ 1,528 $ 529 27% $ 456 30%
Net investment income 100 90 83 10 11 7 8
Other revenues 26 21 15 5 24 6 40
Segment revenues 2,639 2,095 1,626 544 26 469 29
Benefits and expenses 2,412 1,916 1,492 496 26 424 28
Income before taxes 227 179 134 48 27 45 34
Income taxes 50 36 36 14 39 – –
Income attributable to redeemable noncontrolling interest 2 1 – 1 100 1
Income attributable to other noncontrolling interest – – 1 – (1) (100)
SEGMENT EARNINGS 175 142 97 33 23 45 46
Less: special items (after-tax) included in segment
earnings:
Charges for organizational efficiency plans (See Note 6 to
the Consolidated Financial Statements) (8) (6) – (2) (6)
Costs associated with acquisitions (See Note 3 to the
Consolidated Financial Statements) – – (3) – 3
ADJUSTED INCOME FROM OPERATIONS $ 183 $ 148 $ 100 $ 35 24% $ 48 48%
Adjusted income from operations, using actual 2013
currency exchange rates $ 183 $ 152 $ 101 $ 31 20% $ 51 50%
Realized investment gains, net of taxes $ 5 $ 1 $ 1 $ 4 400% $ – –%
Effective tax rate 22.0% 20.1% 26.9% 1.9% (6.8)%
exchange rates to 2012 and 2011 results, premiums and fees increased
Earnings Discussion: 2013 compared to 2012
by 25% in 2013 and 32% in 2012. These increases are primarily
The increase in segment earnings (as well as the increase in adjusted attributable to the acquisitions, and to a lesser extent, strong
income from operations) was primarily driven by business growth, persistency, and new sales growth, particularly in South Korea.
primarily in South Korea, lower acquisition costs in Europe reflecting Net investment income increased in 2013 compared with 2012,
a decision to cease selling activities in certain markets, and earnings of primarily due to the acquisitions in the second half of 2012. In 2012,
the acquisitions during the second half of 2012, partially offset by net investment income increased compared with 2011, primarily due
higher acquisition and benefits expenses. to asset growth in South Korea.
Earnings Discussion: 2012 compared to 2011
Benefits and Expenses
The increase in segment earnings (as well as the increase in adjusted
Benefits and expenses increased in each of 2013 and 2012, compared
income from operations) was primarily driven by strong revenue
with the comparable prior year. Excluding the organizational
growth, primarily in South Korea and, to a lesser extent, margin
efficiency plan charges from 2013 and 2012 and applying actual 2013
improvement largely attributable to disciplined management of
currency exchange rates to 2012 results, benefits and expenses
solicitation spending.
increased by 25%. These increases were primarily due to the
acquisitions and business growth. Excluding the special items in the
Revenues
table above and applying actual 2013 currency exchange rates to
results, benefits and expenses increased 30% in 2012, compared with
Premiums and fees increased in both 2013 and 2012 compared with 2011, primarily due to the acquisitions and business growth.
the comparable prior year. When applying actual 2013 currency
48 CIGNA CORPORATION - 2013 Form 10-K
•
•
•