Cigna 2013 Annual Report Download - page 115
Download and view the complete annual report
Please find page 115 of the 2013 Cigna annual report below. You can navigate through the pages in the report by either clicking on the pages listed below, or by using the keyword search tool below to find specific information within the annual report.-
 1
1 -
2
-
3
-
4
-
5
-
6
-
7
-
8
-
9
-
10
-
11
-
12
-
13
-
14
-
15
-
16
-
17
-
18
-
19
-
20
-
21
-
22
-
23
-
24
-
25
-
26
-
27
-
28
-
29
-
30
-
31
-
32
-
33
-
34
-
35
-
36
-
37
-
38
-
39
-
40
-
41
-
42
-
43
-
44
-
45
-
46
-
47
-
48
-
49
-
50
-
51
-
52
-
53
-
54
-
55
-
56
-
57
-
58
-
59
-
60
-
61
-
62
-
63
-
64
-
65
-
66
-
67
-
68
-
69
-
70
-
71
-
72
-
73
-
74
-
75
-
76
-
77
-
78
-
79
-
80
-
81
-
82
-
83
-
84
-
85
-
86
-
87
-
88
-
89
-
90
-
91
-
92
-
93
-
94
-
95
-
96
-
97
-
98
-
99
-
100
-
101
-
102
-
103
-
104
-
 105
105 -
 106
106 -
 107
107 -
 108
108 -
 109
109 -
 110
110 -
 111
111 -
 112
112 -
 113
113 -
 114
114 -
 115
115 -
 116
116 -
 117
117 -
 118
118 -
 119
119 -
 120
120 -
 121
121 -
 122
122 -
 123
123 -
 124
124 -
 125
125 -
126
-
127
-
128
-
129
-
130
-
131
-
132
-
133
-
134
-
135
-
136
-
137
-
138
-
139
-
140
-
141
-
142
-
143
-
144
-
145
-
146
-
147
-
148
-
149
-
150
-
151
-
152
-
153
-
154
-
155
-
156
-
157
-
158
-
159
-
160
-
161
-
162
-
163
-
164
-
165
-
166
-
167
-
168
-
169
-
170
-
171
-
172
-
173
-
174
-
175
-
176
-
177
-
178
-
179
-
180
-
181
-
182
 |
 |

PART II
ITEM 8. Financial Statements and Supplementary Data
accumulated benefit obligations of $4.7 billion as of December 31, 2014, the Company expects to make minimum required
2013 and $5.3 billion as of December 31, 2012. contributions totaling approximately $100 million. Future years’
contributions will ultimately be based on a wide range of factors
The Company funds its qualified pension plans at least at the including but not limited to asset returns, discount rates, and funding
minimum amount required by the Employee Retirement Income targets.
Security Act of 1974 and the Pension Protection Act of 2006. For
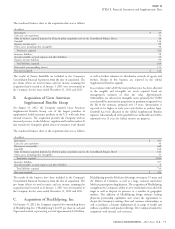
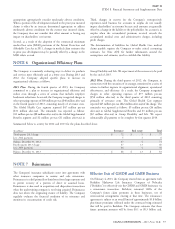
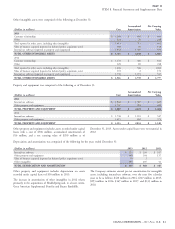
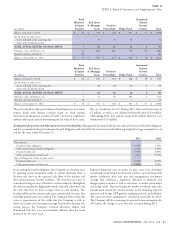
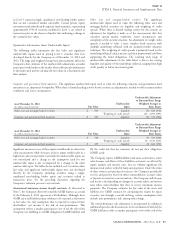
Components of net pension cost for the years ended December 31 were as follows:
(In millions)
2013 2012 2011
Service cost $3 $3 $2
Interest cost 181 198 228
Expected long-term return on plan assets (272) (270) (267)
Amortization of:
Net loss from past experience 74 58 38
Settlement loss –6–
NET PENSION COST $ (14) $ (5) $ 1
The Company expects to recognize pre-tax losses of $57 million in Other postretirement benefits. Unfunded retiree health benefit
2014 from amortization of past experience. This estimate is based on a plans had accumulated benefit obligations of $190 million at
weighted average amortization period for the frozen and inactive plans December 31, 2013 and $294 million at December 31, 2012. Retiree
that is based on the average expected remaining life of plan life insurance plans had accumulated benefit obligations of
participants of approximately 28 years. $133 million as of December 31, 2013 and $148 million as of
December 31, 2012.
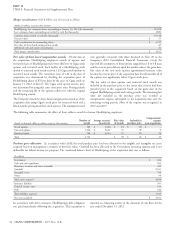
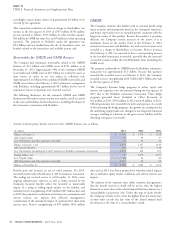
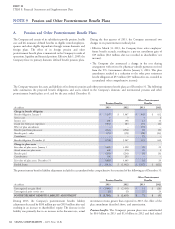
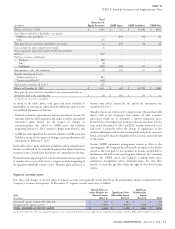
Components of net other postretirement benefit cost for the years ended December 31 were as follows:
(In millions)
2013 2012 2011
Service cost $1 $2 $2
Interest cost 12 16 20
Expected long-term return on plan assets (1) (1) (1)
Amortization of:
Prior service cost (4) (12) (16)
Curtailment gain (19) – –
NET OTHER POSTRETIREMENT BENEFIT COST $ (11) $ 5 $ 5
The Company expects to recognize immaterial pre-tax gains related to based on an average expected remaining life of plan participants of
amortization of prior service cost and no pre-tax gains from 28 years.
amortization of past experience in 2014. The amortization period is
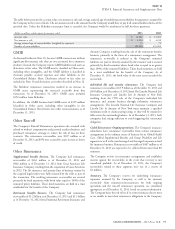
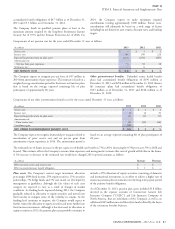
The estimated rate of future increases in the per capita cost of health care benefits is 7% in 2014, decreasing by 0.5% per year to 5% in 2018 and
beyond. This estimate reflects the Company’s current claim experience and management’s estimate that rates of growth will decline in the future.
A 1% increase or decrease in the estimated rate would have changed 2013 reported amounts as follows:
(In millions)
Increase Decrease
Effect on total service and interest cost $– $ –
Effect on postretirement benefit obligation $3 $ –
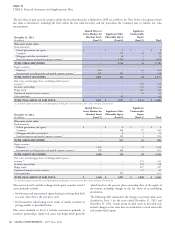
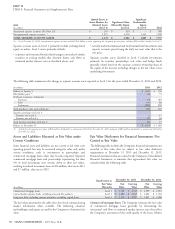
Plan assets. The Company’s current target investment allocation include a 29% allocation of equity securities, consisting of domestic
percentages (50% fixed income, 25% equity securities, 11% securities and international investments, in an effort to achieve a higher rate of
partnerships, 7% hedge funds and 7% real estate) are developed by return on pension plan investments over the long-term payout period
management as guidelines, although the fair values of each asset of the pension benefit obligations.
category are expected to vary as a result of changes in market As of December 31, 2013, pension plan assets included $3.8 billion
conditions. As funding levels improved during 2013, the Company invested in the separate accounts of Connecticut General Life
gradually reduced its allocation to equity securities and moved into Insurance Company (‘‘CGLIC’’) and Life Insurance Company of
fixed income to mitigate some of the volatility in returns. As the North America, that are subsidiaries of the Company, as well as an
funding level continues to improve, the Company would expect to additional $245 million invested directly in funds offered by the buyer
further reduce the allocation to equity securities and move further into of the retirement benefits business.
fixed income investments. Although it has decreased its allocation to
equity securities in 2013, the pension plan asset portfolio continues to
CIGNA CORPORATION - 2013 Form 10-K 83