Cigna 2013 Annual Report Download - page 78
Download and view the complete annual report
Please find page 78 of the 2013 Cigna annual report below. You can navigate through the pages in the report by either clicking on the pages listed below, or by using the keyword search tool below to find specific information within the annual report.-
 1
1 -
2
-
3
-
4
-
5
-
6
-
7
-
8
-
9
-
10
-
11
-
12
-
13
-
14
-
15
-
16
-
17
-
18
-
19
-
20
-
21
-
22
-
23
-
24
-
25
-
26
-
27
-
28
-
29
-
30
-
31
-
32
-
33
-
34
-
35
-
36
-
37
-
38
-
39
-
40
-
41
-
42
-
43
-
44
-
45
-
46
-
47
-
48
-
49
-
50
-
51
-
52
-
53
-
54
-
55
-
56
-
57
-
58
-
59
-
60
-
61
-
62
-
63
-
64
-
65
-
66
-
67
-
 68
68 -
 69
69 -
 70
70 -
 71
71 -
 72
72 -
 73
73 -
 74
74 -
 75
75 -
 76
76 -
 77
77 -
 78
78 -
 79
79 -
 80
80 -
 81
81 -
 82
82 -
 83
83 -
 84
84 -
 85
85 -
 86
86 -
 87
87 -
 88
88 -
89
-
90
-
91
-
92
-
93
-
94
-
95
-
96
-
97
-
98
-
99
-
100
-
101
-
102
-
103
-
104
-
105
-
106
-
107
-
108
-
109
-
110
-
111
-
112
-
113
-
114
-
115
-
116
-
117
-
118
-
119
-
120
-
121
-
122
-
123
-
124
-
125
-
126
-
127
-
128
-
129
-
130
-
131
-
132
-
133
-
134
-
135
-
136
-
137
-
138
-
139
-
140
-
141
-
142
-
143
-
144
-
145
-
146
-
147
-
148
-
149
-
150
-
151
-
152
-
153
-
154
-
155
-
156
-
157
-
158
-
159
-
160
-
161
-
162
-
163
-
164
-
165
-
166
-
167
-
168
-
169
-
170
-
171
-
172
-
173
-
174
-
175
-
176
-
177
-
178
-
179
-
180
-
181
-
182
 |
 |

PART II
ITEM 7. Management’s Discussion and Analysis of Financial Condition and Results of Operations
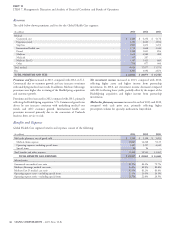
Revenues
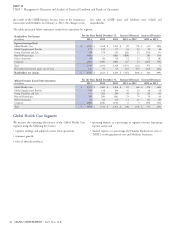
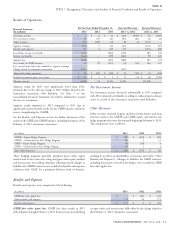
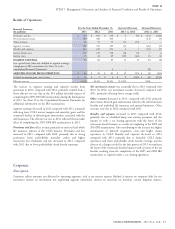
The table below shows premiums and fees for the Global Health Care segment:
(In millions)
2013 2012 2011
Medical:
Guaranteed cost $ 4,463 $ 4,256 $ 4,176
Experience-rated 2,292 2,022 1,934
Stop loss 1,907 1,672 1,451
International health care 1,752 1,648 1,344
Dental 1,139 1,005 894
Medicare 5,639 4,969 489
Medicaid 317 207 –
Medicare Part D 1,387 1,421 685
Other 730 677 600
Total medical 19,626 17,877 11,573
Fees 3,307 3,096 2,870
TOTAL PREMIUMS AND FEES $ 22,933 $ 20,973 $ 14,443
Premiums and fees increased in 2013, compared with 2012, in U.S. Net investment income increased in 2013, compared with 2012,
Commercial due to customer growth and rate increases consistent reflecting higher assets and higher income from partnership
with underlying medical cost trends. In addition, Medicare Advantage investments. In 2012, net investment income decreased compared
premiums were higher due to timing of the HealthSpring acquisition with 2011 reflecting lower yields, partially offset by the impact of the
and customer growth. HealthSpring acquisition and higher income from partnership
investments.
Premiums and fees increased in 2012 compared with 2011, primarily
reflecting the HealthSpring acquisition. U.S. Commercial growth was Mail order pharmacy revenues increased in each of 2013 and 2012,
driven by rate increases consistent with underlying medical cost compared with each prior year, primarily reflecting higher
trends, and ASO customer growth. International health care prescription volume for specialty medications (injectibles).
premiums increased primarily due to the conversion of Vanbreda
business from service to risk.
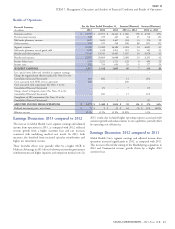
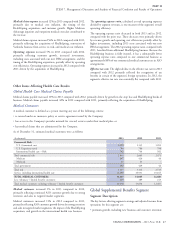
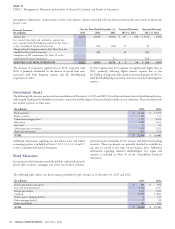
Benefits and Expenses
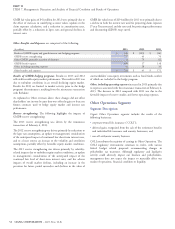
Global Health Care segment benefits and expenses consist of the following:
(In millions)
2013 2012 2011
Mail order pharmacy cost of goods sold $ 1,509 $ 1,328 $ 1,203
Medical claims expense 15,867 14,228 9,125
Operating expenses, excluding special items 5,497 5,217 4,340
Special items 84 96 –
Total benefits and other expenses 21,448 19,541 13,465
TOTAL BENEFITS AND EXPENSES $ 22,957 $ 20,869 $ 14,668
Selected ratios
Guaranteed cost medical care ratio 81.5% 80.2% 79.7%
Medicare Advantage medical care ratio 84.8% 80.9% 89.6%
Medicare Part D medical care ratio 82.3% 81.2% 83.4%
Operating expense ratio – including special items 22.1% 23.0% 26.5%
Operating expense ratio – excluding special items 21.7% 22.6% 26.5%
46 CIGNA CORPORATION - 2013 Form 10-K