Cigna 2013 Annual Report Download - page 113
Download and view the complete annual report
Please find page 113 of the 2013 Cigna annual report below. You can navigate through the pages in the report by either clicking on the pages listed below, or by using the keyword search tool below to find specific information within the annual report.-
 1
1 -
2
-
3
-
4
-
5
-
6
-
7
-
8
-
9
-
10
-
11
-
12
-
13
-
14
-
15
-
16
-
17
-
18
-
19
-
20
-
21
-
22
-
23
-
24
-
25
-
26
-
27
-
28
-
29
-
30
-
31
-
32
-
33
-
34
-
35
-
36
-
37
-
38
-
39
-
40
-
41
-
42
-
43
-
44
-
45
-
46
-
47
-
48
-
49
-
50
-
51
-
52
-
53
-
54
-
55
-
56
-
57
-
58
-
59
-
60
-
61
-
62
-
63
-
64
-
65
-
66
-
67
-
68
-
69
-
70
-
71
-
72
-
73
-
74
-
75
-
76
-
77
-
78
-
79
-
80
-
81
-
82
-
83
-
84
-
85
-
86
-
87
-
88
-
89
-
90
-
91
-
92
-
93
-
94
-
95
-
96
-
97
-
98
-
99
-
100
-
101
-
102
-
 103
103 -
 104
104 -
 105
105 -
 106
106 -
 107
107 -
 108
108 -
 109
109 -
 110
110 -
 111
111 -
 112
112 -
 113
113 -
 114
114 -
 115
115 -
 116
116 -
 117
117 -
 118
118 -
 119
119 -
 120
120 -
 121
121 -
 122
122 -
 123
123 -
124
-
125
-
126
-
127
-
128
-
129
-
130
-
131
-
132
-
133
-
134
-
135
-
136
-
137
-
138
-
139
-
140
-
141
-
142
-
143
-
144
-
145
-
146
-
147
-
148
-
149
-
150
-
151
-
152
-
153
-
154
-
155
-
156
-
157
-
158
-
159
-
160
-
161
-
162
-
163
-
164
-
165
-
166
-
167
-
168
-
169
-
170
-
171
-
172
-
173
-
174
-
175
-
176
-
177
-
178
-
179
-
180
-
181
-
182
 |
 |

PART II
ITEM 8. Financial Statements and Supplementary Data
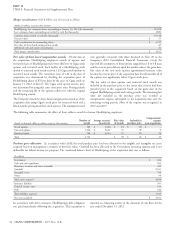
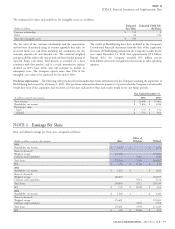
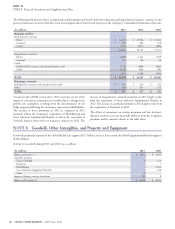
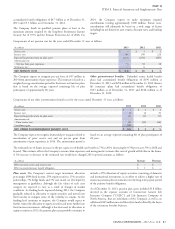
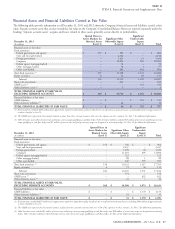
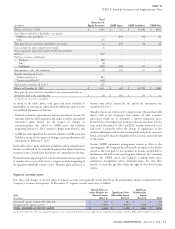
Other intangible assets were comprised of the following at December 31:
Accumulated Net Carrying
(Dollars in millions) Cost Amortization Value
2013
Customer relationships $ 1,289 $ 635 $ 654
Other 324 76 248
Total reported in other assets, including other intangibles 1,613 711 902
Value of business acquired (reported in deferred policy acquisition costs) 168 20 148
Internal-use software (reported in property and equipment) 1,942 1,307 635
TOTAL OTHER INTANGIBLE ASSETS $ 3,723 $ 2,038 $ 1,685
2012
Customer relationships $ 1,278 $ 466 $ 812
Other 328 80 248
Total reported in other assets, including other intangibles 1,606 546 1,060
Value of business acquired (reported in deferred policy acquisition costs) 172 2 170
Internal-use software (reported in property and equipment) 1,738 1,191 547
TOTAL OTHER INTANGIBLE ASSETS $ 3,516 $ 1,739 $ 1,777
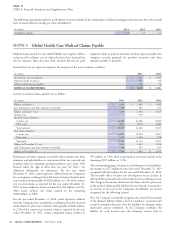
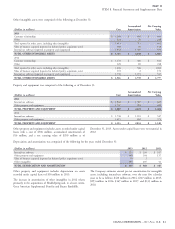
Property and equipment was comprised of the following as of December 31:
Accumulated Net Carrying
(Dollars in millions) Cost Amortization Value
2013
Internal-use software $ 1,942 $ 1,307 $ 635
Other property and equipment 1,747 918 829
TOTAL PROPERTY AND EQUIPMENT $ 3,689 $ 2,225 $ 1,464
2012
Internal-use software $ 1,738 $ 1,191 $ 547
Other property and equipment 1,415 842 573
TOTAL PROPERTY AND EQUIPMENT $ 3,153 $ 2,033 $ 1,120
Other property and equipment includes assets recorded under capital December 31, 2013. Assets under capital leases were not material in
leases with a cost of $306 million, accumulated amortization of 2012.
$16 million, and a net carrying value of $290 million as of
Depreciation and amortization was comprised of the following for the years ended December 31:
(Dollars in millions) 2013 2012 2011
Internal-use software $ 225 $ 209 $ 187
Other property and equipment 160 144 117
Value of business acquired (reported in deferred policy acquisition costs) 19 2 -
Other intangibles 193 205 41
TOTAL DEPRECIATION AND AMORTIZATION $ 597 $ 560 $ 345
Other property and equipment includes depreciation on assets The Company estimates annual pre-tax amortization for intangible
recorded under capital leases of $16 million in 2013. assets, including internal-use software, over the next five calendar
years to be as follows: $410 million in 2014, $327 million in 2015,
The increase in amortization of other intangibles in 2012 relates $253 million in 2016, $167 million in 2017, and $133 million in
primarily to the acquisitions of HealthSpring and, to a lesser extent, 2018.
Great American Supplemental Benefits and Finans Emeklilik.
CIGNA CORPORATION - 2013 Form 10-K 81