Cigna 2013 Annual Report Download - page 77
Download and view the complete annual report
Please find page 77 of the 2013 Cigna annual report below. You can navigate through the pages in the report by either clicking on the pages listed below, or by using the keyword search tool below to find specific information within the annual report.-
 1
1 -
2
-
3
-
4
-
5
-
6
-
7
-
8
-
9
-
10
-
11
-
12
-
13
-
14
-
15
-
16
-
17
-
18
-
19
-
20
-
21
-
22
-
23
-
24
-
25
-
26
-
27
-
28
-
29
-
30
-
31
-
32
-
33
-
34
-
35
-
36
-
37
-
38
-
39
-
40
-
41
-
42
-
43
-
44
-
45
-
46
-
47
-
48
-
49
-
50
-
51
-
52
-
53
-
54
-
55
-
56
-
57
-
58
-
59
-
60
-
61
-
62
-
63
-
64
-
65
-
66
-
 67
67 -
 68
68 -
 69
69 -
 70
70 -
 71
71 -
 72
72 -
 73
73 -
 74
74 -
 75
75 -
 76
76 -
 77
77 -
 78
78 -
 79
79 -
 80
80 -
 81
81 -
 82
82 -
 83
83 -
 84
84 -
 85
85 -
 86
86 -
 87
87 -
88
-
89
-
90
-
91
-
92
-
93
-
94
-
95
-
96
-
97
-
98
-
99
-
100
-
101
-
102
-
103
-
104
-
105
-
106
-
107
-
108
-
109
-
110
-
111
-
112
-
113
-
114
-
115
-
116
-
117
-
118
-
119
-
120
-
121
-
122
-
123
-
124
-
125
-
126
-
127
-
128
-
129
-
130
-
131
-
132
-
133
-
134
-
135
-
136
-
137
-
138
-
139
-
140
-
141
-
142
-
143
-
144
-
145
-
146
-
147
-
148
-
149
-
150
-
151
-
152
-
153
-
154
-
155
-
156
-
157
-
158
-
159
-
160
-
161
-
162
-
163
-
164
-
165
-
166
-
167
-
168
-
169
-
170
-
171
-
172
-
173
-
174
-
175
-
176
-
177
-
178
-
179
-
180
-
181
-
182
 |
 |

PART II
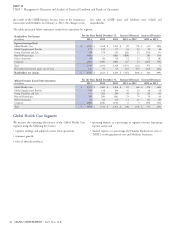
ITEM 7. Management’s Discussion and Analysis of Financial Condition and Results of Operations
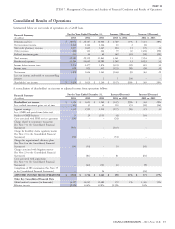
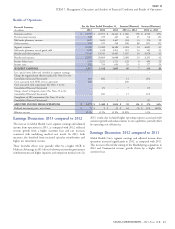
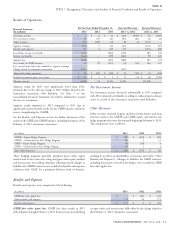
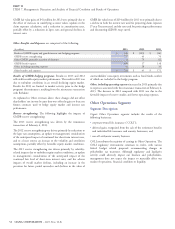
Results of Operations
For the Years Ended December 31, Increase/(Decrease) Increase/(Decrease)
Financial Summary
(In millions)
2013 2012 2011 2013 vs. 2012 2012 vs. 2011
Premiums and fees $ 22,933 $ 20,973 $ 14,443 $ 1,960 9% $ 6,530 45%
Net investment income 325 259 263 66 25 (4) (2)
Mail order pharmacy revenues 1,827 1,623 1,447 204 13 176 12
Other revenues 211 225 236 (14) (6) (11) (5)
Segment revenues 25,296 23,080 16,389 2,216 10 6,691 41
Mail order pharmacy cost of goods sold 1,509 1,328 1,203 181 14 125 10
Benefits and other expenses 21,448 19,541 13,465 1,907 10 6,076 45
Benefits and expenses 22,957 20,869 14,668 2,088 10 6,201 42
Income before taxes 2,339 2,211 1,721 128 6 490 28
Income taxes 822 793 616 29 4 177 29
SEGMENT EARNINGS 1,517 1,418 1,105 99 7 313 28
Less: special items (after-tax) included in segment earnings: –
Charge for organizational efficiency plan (See Note 6 to the
Consolidated Financial Statements) (31) (42) – 11 (42)
Costs associated with PBM services agreement (24) – – (24) –
Costs associated with acquisitions (See Note 3 to the
Consolidated Financial Statements) – (7) – 7 (7)
Charge related to litigation matter (See Note 23 to the
Consolidated Financial Statements) – (13) – 13 (13)
Completion of IRS examination (See Note 19 to the
Consolidated Financial Statements) – – 1 – (1)
ADJUSTED INCOME FROM OPERATIONS $ 1,572 $ 1,480 $ 1,104 $ 92 6% $ 376 34%
Realized investment gains, net of taxes $ 73 $ 9 $ 23 $ 64 –% $ (14) (61)%
Effective tax rate 35.1% 35.9% 35.8% (0.8)% 0.1%
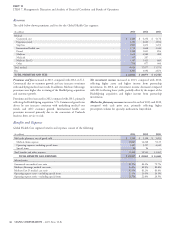
2013, results also included higher operating expenses associated with
Earnings Discussion: 2013 compared to 2012
customer growth and enhancements to our capabilities, partially offset
The increase in Global Health Care’s segment earnings and adjusted by operating cost efficiencies.
income from operations in 2013, as compared with 2012, reflected
revenue growth from a higher customer base and rate increases
Earnings Discussion: 2012 compared to 2011
consistent with underlying medical cost trends. In 2013, both
measures also benefited from increased specialty contributions and Global Health Care’s segment earnings and adjusted income from
higher net investment income. operations increased significantly in 2012, as compared with 2011.
This increase reflected the timing of the HealthSpring acquisition in
These favorable effects were partially offset by a higher MCR in 2012 and Commercial revenue growth driven by a higher ASO
Medicare Advantage in 2013 driven by lower per member government customer base.
reimbursements and higher inpatient and outpatient medical costs. In
CIGNA CORPORATION - 2013 Form 10-K 45