Cigna 2013 Annual Report Download - page 123
Download and view the complete annual report
Please find page 123 of the 2013 Cigna annual report below. You can navigate through the pages in the report by either clicking on the pages listed below, or by using the keyword search tool below to find specific information within the annual report.-
 1
1 -
2
-
3
-
4
-
5
-
6
-
7
-
8
-
9
-
10
-
11
-
12
-
13
-
14
-
15
-
16
-
17
-
18
-
19
-
20
-
21
-
22
-
23
-
24
-
25
-
26
-
27
-
28
-
29
-
30
-
31
-
32
-
33
-
34
-
35
-
36
-
37
-
38
-
39
-
40
-
41
-
42
-
43
-
44
-
45
-
46
-
47
-
48
-
49
-
50
-
51
-
52
-
53
-
54
-
55
-
56
-
57
-
58
-
59
-
60
-
61
-
62
-
63
-
64
-
65
-
66
-
67
-
68
-
69
-
70
-
71
-
72
-
73
-
74
-
75
-
76
-
77
-
78
-
79
-
80
-
81
-
82
-
83
-
84
-
85
-
86
-
87
-
88
-
89
-
90
-
91
-
92
-
93
-
94
-
95
-
96
-
97
-
98
-
99
-
100
-
101
-
102
-
103
-
104
-
105
-
106
-
107
-
108
-
109
-
110
-
111
-
112
-
 113
113 -
 114
114 -
 115
115 -
 116
116 -
 117
117 -
 118
118 -
 119
119 -
 120
120 -
 121
121 -
 122
122 -
 123
123 -
 124
124 -
 125
125 -
 126
126 -
 127
127 -
 128
128 -
 129
129 -
 130
130 -
 131
131 -
 132
132 -
 133
133 -
134
-
135
-
136
-
137
-
138
-
139
-
140
-
141
-
142
-
143
-
144
-
145
-
146
-
147
-
148
-
149
-
150
-
151
-
152
-
153
-
154
-
155
-
156
-
157
-
158
-
159
-
160
-
161
-
162
-
163
-
164
-
165
-
166
-
167
-
168
-
169
-
170
-
171
-
172
-
173
-
174
-
175
-
176
-
177
-
178
-
179
-
180
-
181
-
182
 |
 |

PART II
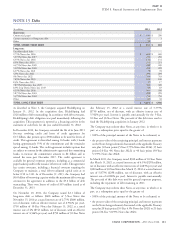
ITEM 8. Financial Statements and Supplementary Data
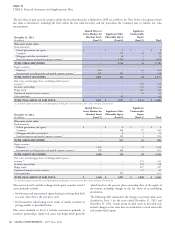
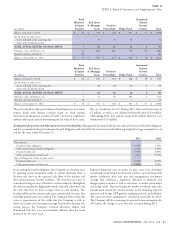
Fixed
Maturities &
(In millions)
Equity Securities GMIB Assets GMIB Liabilities GMIB Net
Balance at January 1, 2012 $ 1,002 $ 712 $ (1,333) $ (621)
Gains (losses) included in shareholders’ net income:
GMIB fair value gain/(loss) – (55) 96 41
Other 13 – – –
Total gains (losses) included in shareholders’ net income 13 (55) 96 41
Gains included in other comprehensive income 8 – – –
Losses required to adjust future policy benefits for settlement
annuities
(1)
(10) – – –
Purchases, issuances, settlements:
Purchases 188 – – –
Sales (1) – – –
Settlements (88) (35) 67 32
Total purchases, sales, and settlements 99 (35) 67 32
Transfers into/(out of ) Level 3:
Transfers into Level 3 283 – – –
Transfers out of Level 3 (44) – – –
Total transfers into/(out of) Level 3 239 – – –
Balance at December 31, 2012 $ 1,351 $ 622 $ (1,170) $ (548)
Total gains (losses) included in shareholders’ net income attributable to
instruments held at the reporting date $ (1) $ (55) $ 96 $ 41
(1) Amounts do not accrue to shareholders.
As noted in the tables above, total gains and losses included in income only reflect activity for the period the instrument was
shareholders’ net income are reflected in the following captions in the classified in Level 3.
Consolidated Statements of Income: Transfers into or out of the Level 3 category occur when unobservable
Realized investment gains (losses) and net investment income for inputs, such as the Company’s best estimate of what a market
amounts related to fixed maturities and equity securities and realized participant would use to determine a current transaction price,
investment gains (losses) for the impact of changes in become more or less significant to the fair value measurement. For the
non-performance risk related to GMIB assets and liabilities years ended December 31, 2013 and 2012, transfers between Level 2
beginning February 4, 2013, similar to hedge ineffectiveness; and and Level 3 primarily reflect the change in significance of the
unobservable inputs used to value certain public and private corporate
GMIB fair value (gain) loss for amounts related to GMIB assets and bonds, principally related to liquidity of the securities and credit risk
liabilities, except for the impact of changes in non-performance risk of the issuers.
subsequent to February 4, 2013.
Because GMIB reinsurance arrangements remain in effect at the
In the tables above, gains and losses included in other comprehensive reporting date, the Company has reflected the total gain or loss for the
income are reflected in net unrealized appreciation (depreciation) on period as the total gain or loss included in income attributable to
securities in the Consolidated Statements of Comprehensive Income. instruments still held at the reporting date. However, the Company
reduces the GMIB assets and liabilities resulting from these
Reclassifications impacting Level 3 financial instruments are reported
reinsurance arrangements when annuitants lapse, die, elect their
as transfers into or out of the Level 3 category as of the beginning of
benefit, or reach the age after which the right to elect their benefit
the quarter in which the transfer occurs. Therefore gains and losses in
expires.
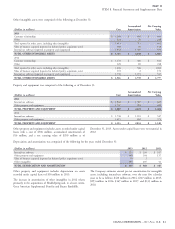
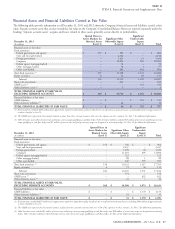
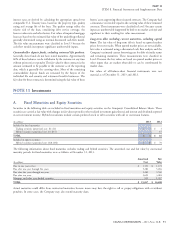
Separate account assets
Fair values and changes in the fair values of separate account assets generally accrue directly to the policyholders and are excluded from the
Company’s revenues and expenses. At December 31, separate account assets were as follows:
Quoted Prices in Significant
Active Markets for Significant Other Unobservable
Identical Assets Observable Inputs Inputs
2013
(In millions)
(Level 1) (Level 2) (Level 3) Total
Guaranteed separate accounts (See Note 23) $ 264 $ 284 $ – $ 548
Non-guaranteed separate accounts
(1)
1,844 4,825 1,035 7,704
TOTAL SEPARATE ACCOUNT ASSETS $ 2,108 $ 5,109 $ 1,035 $ 8,252
(1) As of December 31, 2013, non-guaranteed separate accounts included $3.8 billion in assets supporting the Company’s pension plans, including $983 million classified in Level 3.
CIGNA CORPORATION - 2013 Form 10-K 91
•
•